


SharePoint provides basic reports, but many admins find themselves stitching together exports and PowerShell scripts to get a full picture of their environment. SProbot's all-in-one SharePoint reporting tools are designed to address these native limitations.
Let's explore how SProbot’s Health Check and Recommended Reviews features deliver insights that Microsoft’s built-in tools miss – across storage, security, content, and activity.
In a typical 25TB tenant, there might be:
- 1 500 sites
- 10 million files
- 15 000 sharing links
- Thousands of sharing activities per month
- Hundreds of guest users
With such scale, “Where do I start?” is a question many SharePoint admins ask.
The Challenge with Native SharePoint Reporting
In Microsoft 365, SharePoint reporting is spread across multiple admin interfaces:
- Site Usage pages (on each site) show 90-day metrics for that site.
- The SharePoint Admin Center provides several views filter and sort sites by basic properties and apply top-level admin actions, but lacks the ability to delve into the contents of sites.
- The Microsoft 365 Admin Center offers tenant-wide usage reports (files, active sites, storage) up to 180 days.
- Compliance (Audit) Center logs user activities in detail, but requires complex querying and is limited by retention policies (90 days by default).
While these tools provide valuable data, they have significant limitations:
This is where SProbot comes in. It is designed to centralize SharePoint reporting and turn data into action. SProbot’s Health Check dashboard and detailed Reviews provide a holistic view and pinpoint exactly what needs attention, solving the above challenges.
Below, we break down SProbot’s reporting capabilities in the four key areas of its Health Check – Storage, Security, Content, and Activity – and show how each addresses specific shortcomings of native tools.
1 - Storage: Growth & Cleanup
Native limitations
The SharePoint Admin Center shows storage used per site and overall for the tenant, but that’s about it. You can see current usage and a 30/90/180-day trend, but you won’t know future growth or how much space you could reclaim. There’s no built-in report for largest files or version bloat – admins have to manually find large files or trim versions via PowerShell or third-party scripts.
How SProbot fills the gap
The Storage section of the Health Check delivers insights you cannot get natively:
Growth Trends & Forecasting
SProbot calculates your average growth rate and projects storage costs above the currently purchased quota for the next 12 months, useful for budgeting and avoiding surprises.
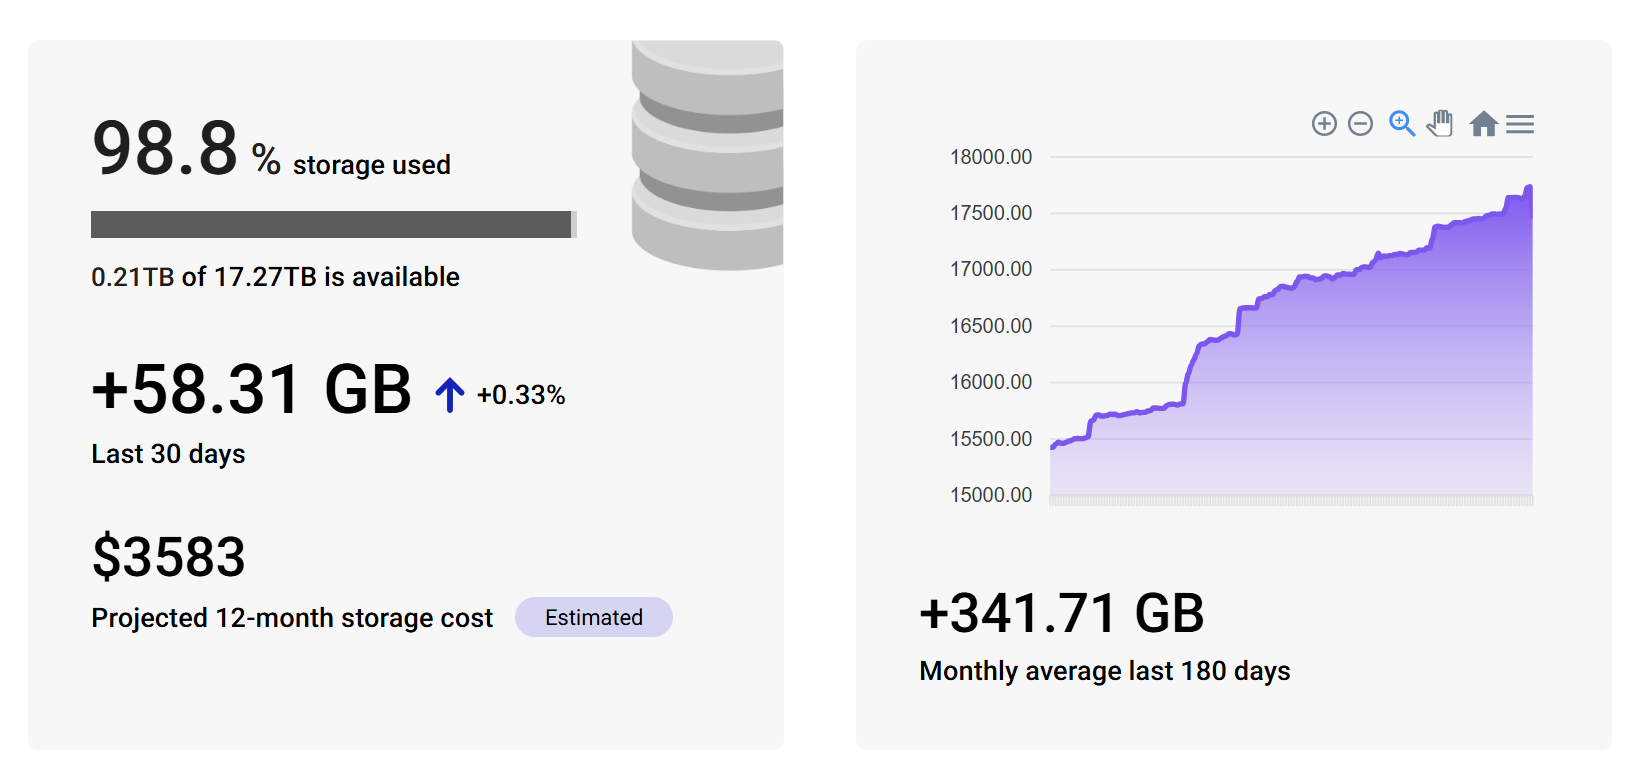
Cleanup Impact
Realistic planning and budgeting relies on accurate tracking of cleanup efforts. SProbot answers the “How much storage have I saved?” question, something native tools don’t do.
For example, if you ran a bulk deletion of old files or versions using SProbot, the Health Check will reflect the GB freed and the $ saved in storage costs.

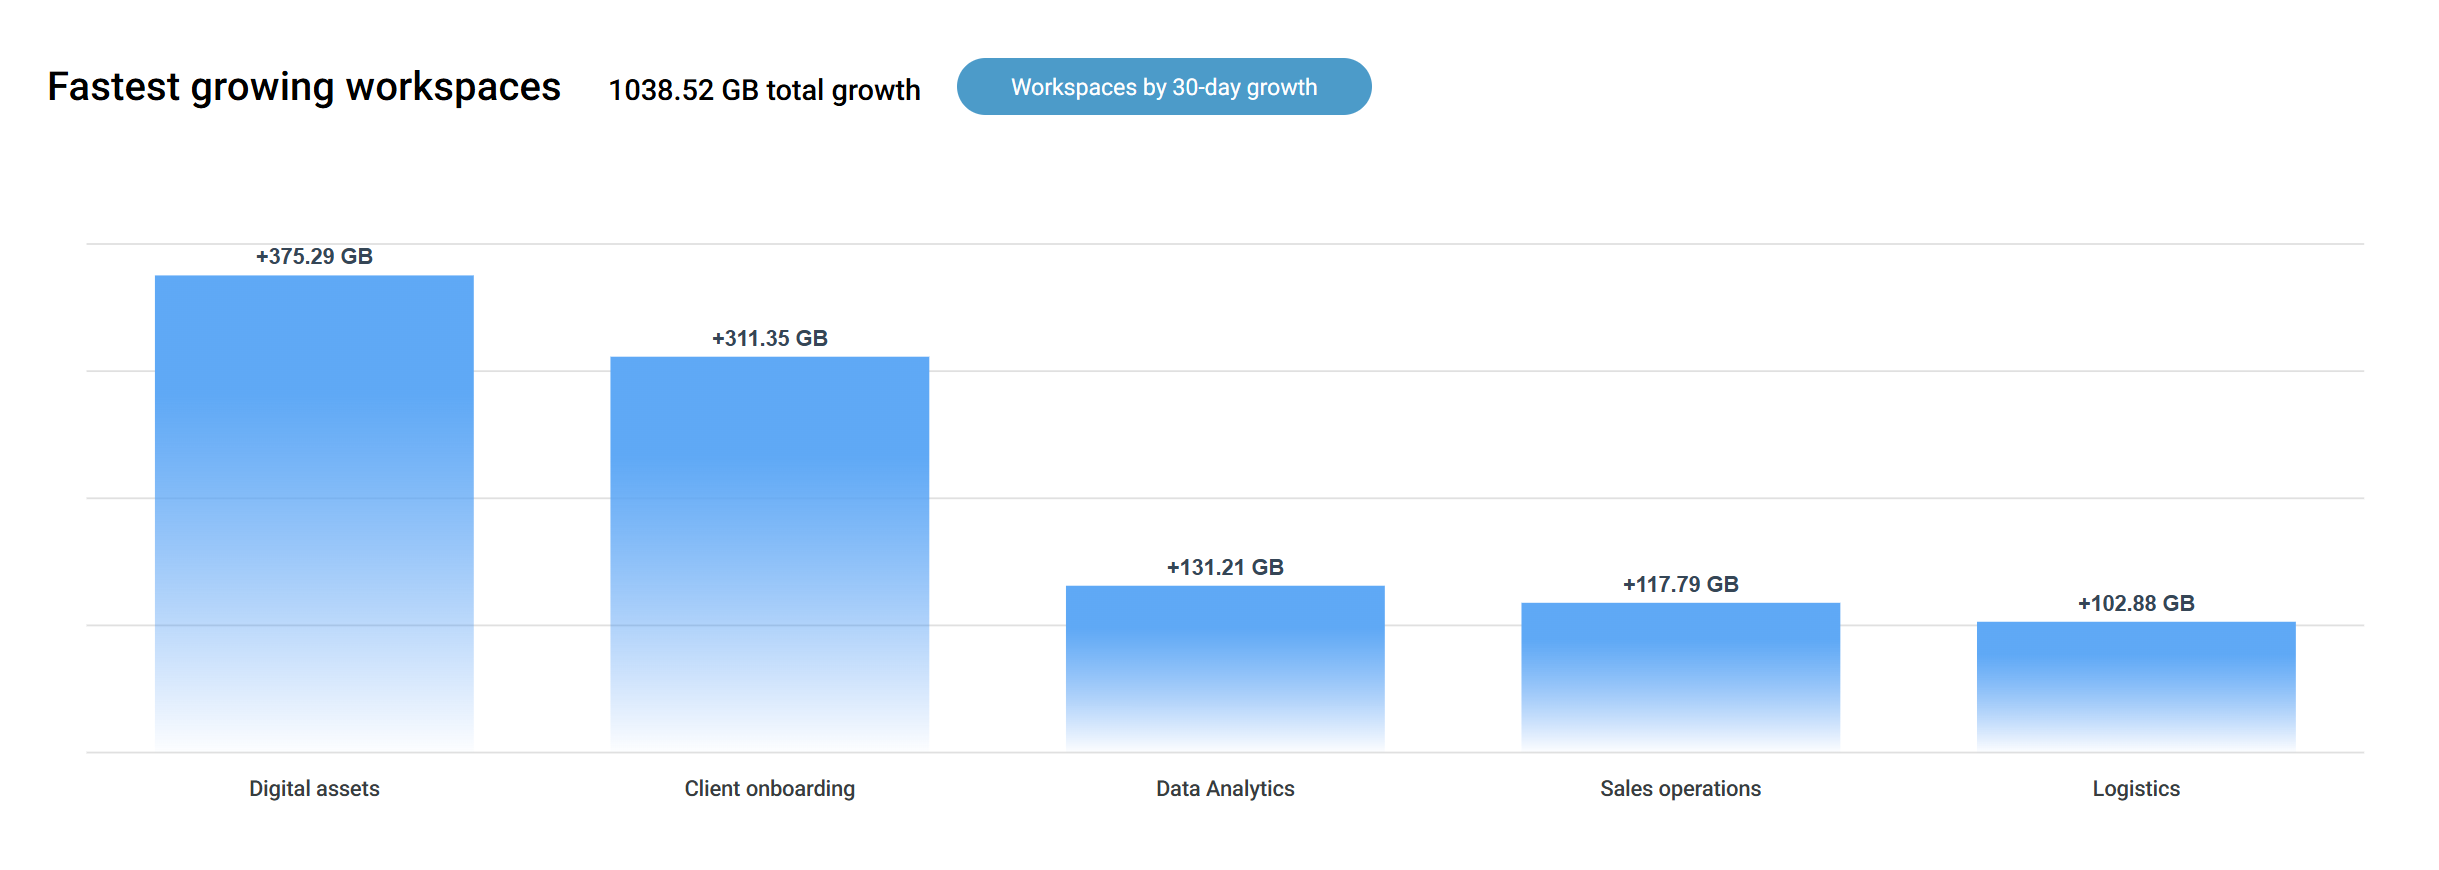
Top Offenders
Instead of manually hunting for rapidly growing sites, SProbot highlights them for you. It lists the sizes and file counts of the largest sites in your tenant, but more importantly which sites grew the most in the last 30 days.
In SharePoint Online, you could sort the Active Sites list by size, but you wouldn’t know which ones are rapidly growing, you can only see tenant growth as a whole. SProbot combines size and growth rate to identify hot spots.
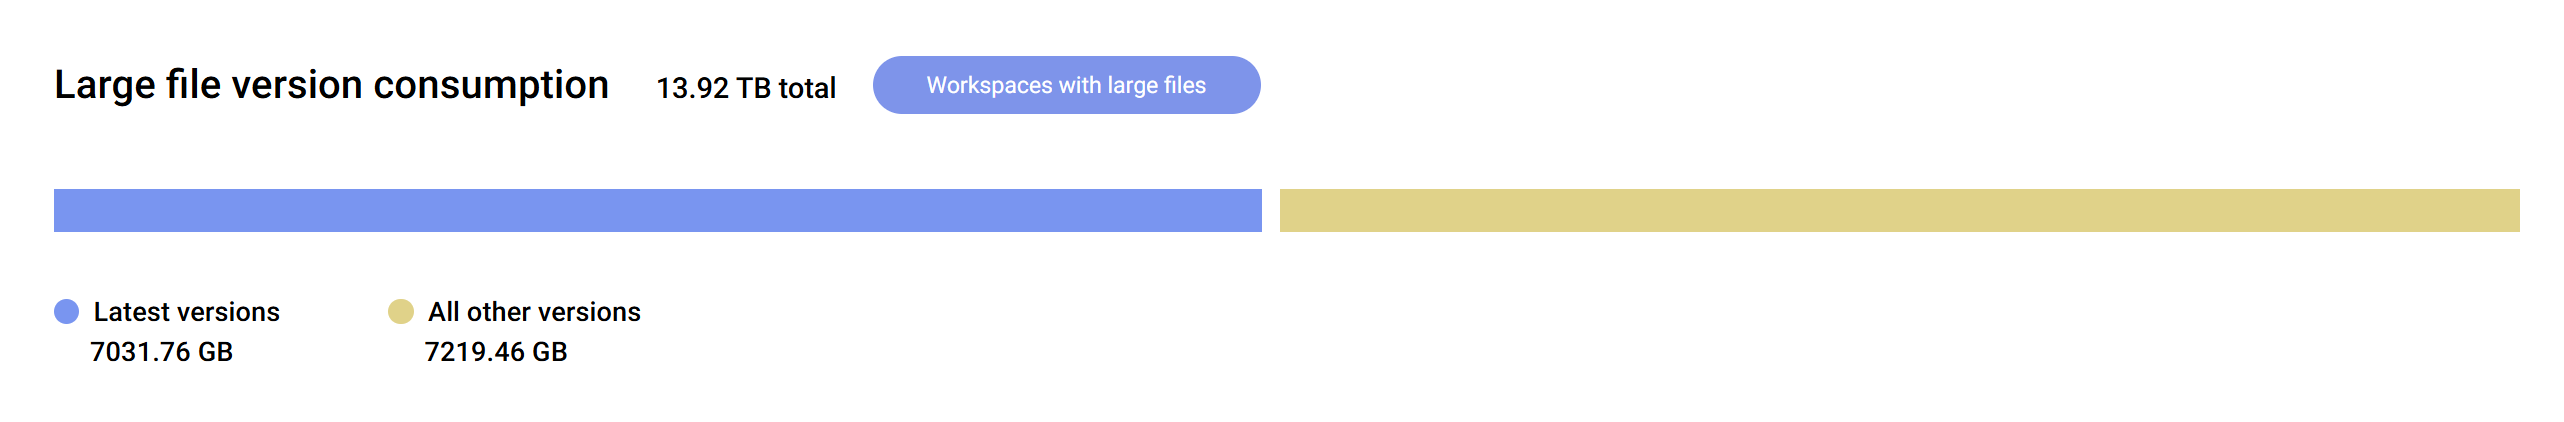
Version History Bloat
Versioning can silently eat up tons of space and result in a tenant running out of its included quota, with additional storage available at $0.20/GB/month. Natively, there’s no report on version storage. SProbot addresses this through its Large File reporting functionality in two ways:
- Within a specific site, you can view a report of all files over a certain size (50 MB) and see how much space all their versions occupy compared to just the latest version.
- For the tenant as a whole, you can view the storage consumed by versions across all sites.
Example: Microsoft will show you the total GB used on the tenant and that one site is 500 GB, but not why.
With SProbot, you might discover that the 500 GB site has 300 GB tied up in document versions (perhaps an active PowerPoint deck with hundreds or even thousands of old versions). The large file report can enable you to trim these versions, quickly freeing 250 GB. Additionally, the Health Check would log those savings and update your cost projections, so you can see the impact of your action.
In the example below from a 65 TB tenant, over 7 TB is consumed by versions other than the latest. If only the latest versions are kept, over $17 000 of annual storage savings can be achieved!
🔗Also see: Trim versions to reduce SharePoint storage cost
Clear visibility
The Storage metrics feed into SProbot’s Recommended Reviews. If a site is one of the fastest growing on the tenant by either file size or file count, it’ll be flagged for you. No need to constantly monitor – SProbot keeps an eye on it.

🔗Read more: SharePoint storage limit exceeded? 6 proven ways to reclaim space
2 - Security & Sharing: Oversight and Control
Native limitations
Security reporting in SharePoint is piecemeal. You can check a site’s sharing setting (Anyone / New and existing guests / Existing guests / Internal only) in the Admin Center or draw a sharing link report per site, but you can’t easily get a list of all external sharing links for all time for a site.
Data Access Governance in SharePoint Advanced Management
The DAG Sharing Links report shows counts of sharing links per site, but only for links created in the last 28 days, and it’s up to you to export and interpret the data.
You’d have to run audit log searches or PowerShell scripts to get granular details. In short, Microsoft gives you broad data without many specifics.
How SProbot fills the gap
The Security section of Health Check, along with SProbot’s security-focused Reviews, shines a light on sharing and access risks.
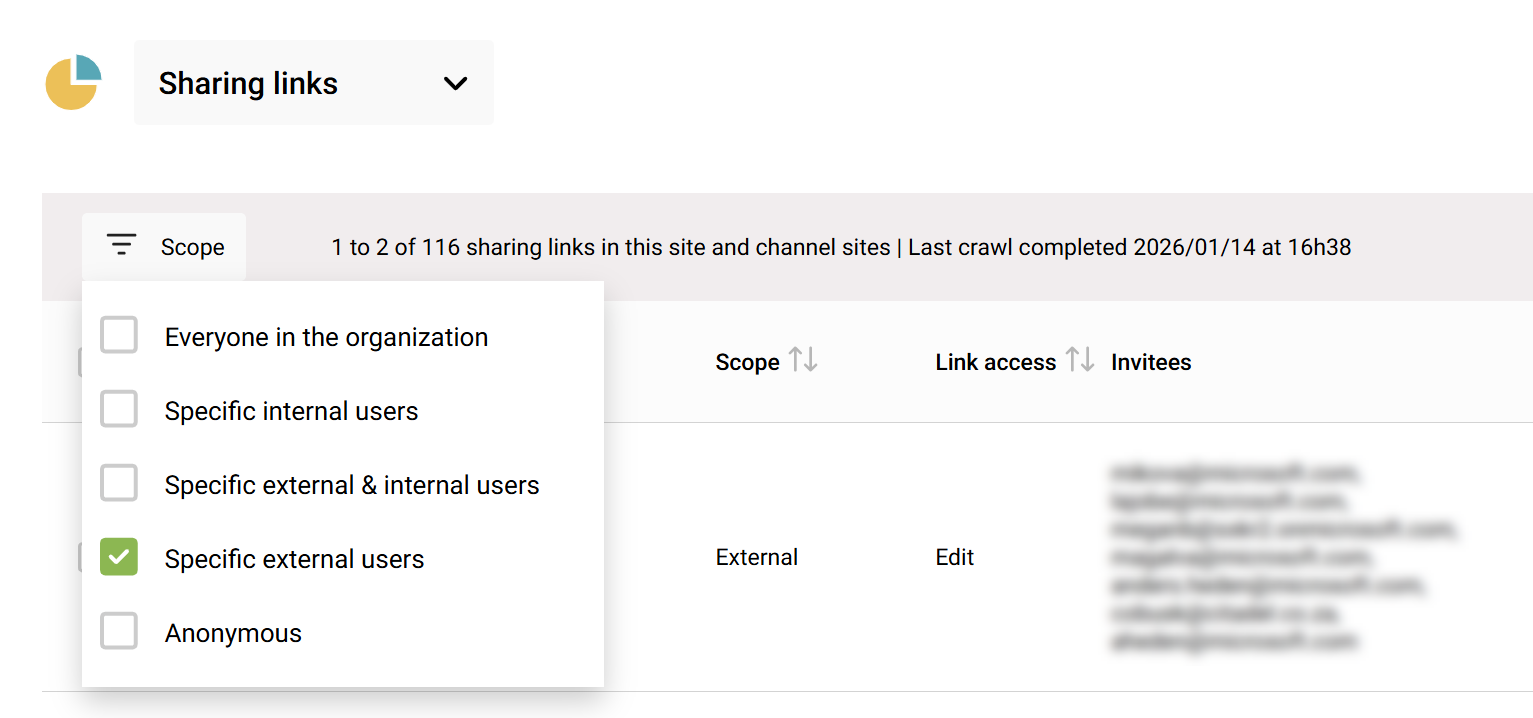
External sharing link inventory
Sharing link reports are available within each site. It shows every file or folder that’s shared, the type of link (Anyone, People in org, Specific people), who created the link, and who it was shared with. This data is for all time, and not only for the last 28 days. This is gold for security reviews: you can, for example, filter to see all anonymous shares in a site. In addition to the DAG functionality, you can also remove them if they’re not needed, with only a few clicks.
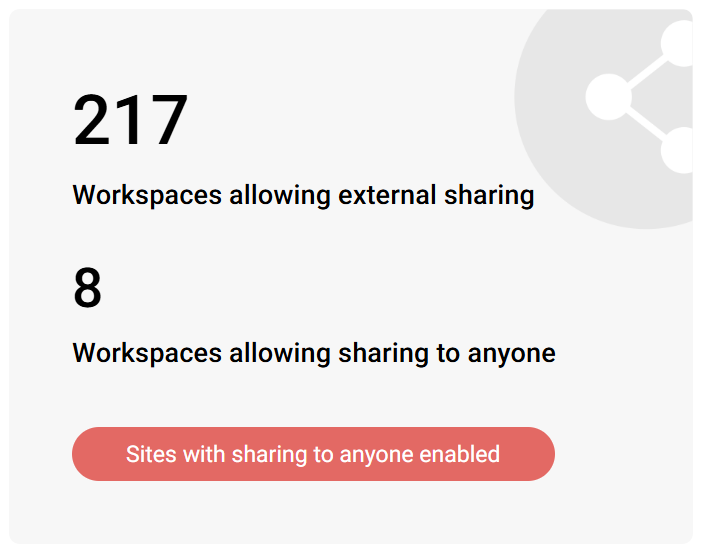
External sharing configuration
SProbot shows you how many sites have external sharing enabled, and how many allow sharing to anyone. This goes beyond the Admin Center, which only lists each site’s setting individually. SProbot aggregates it: for example, out of 1693 sites, 217 allow external sharing; among those, 8 allow anonymous links. This helps you gauge if your org’s settings align with policy.
Orphaned or at-risk Workspaces
One of the best Security insights is identifying workspaces that are orphaned or have a single owner.
Native SharePoint has no alert if a site’s owner left the company or if a team has only one owner. SProbot flags these, because they’re a risk – if the sole owner’s account is disabled, nobody can manage the site.
The Health Check answers the question “Do I have any workspaces which are orphaned or have a single owner only and are at risk of being unmanaged?”.
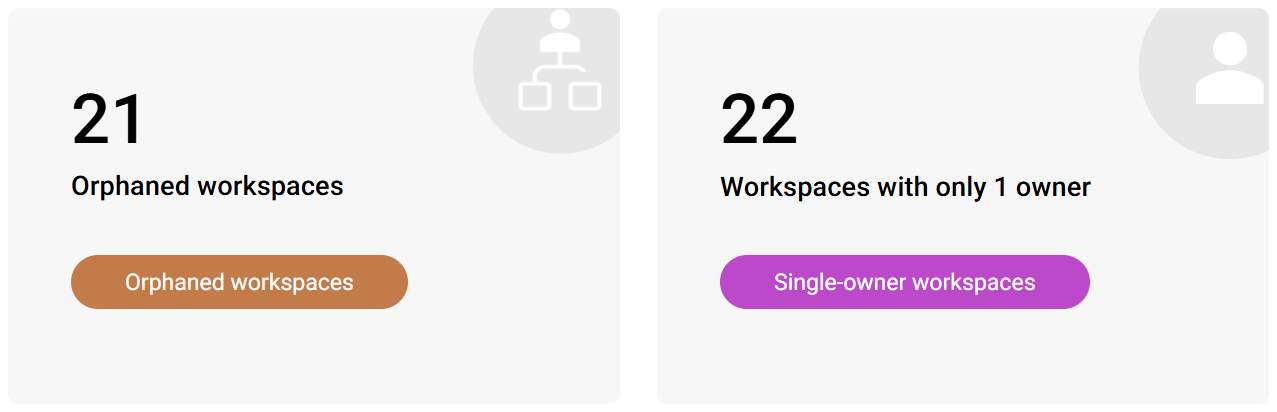
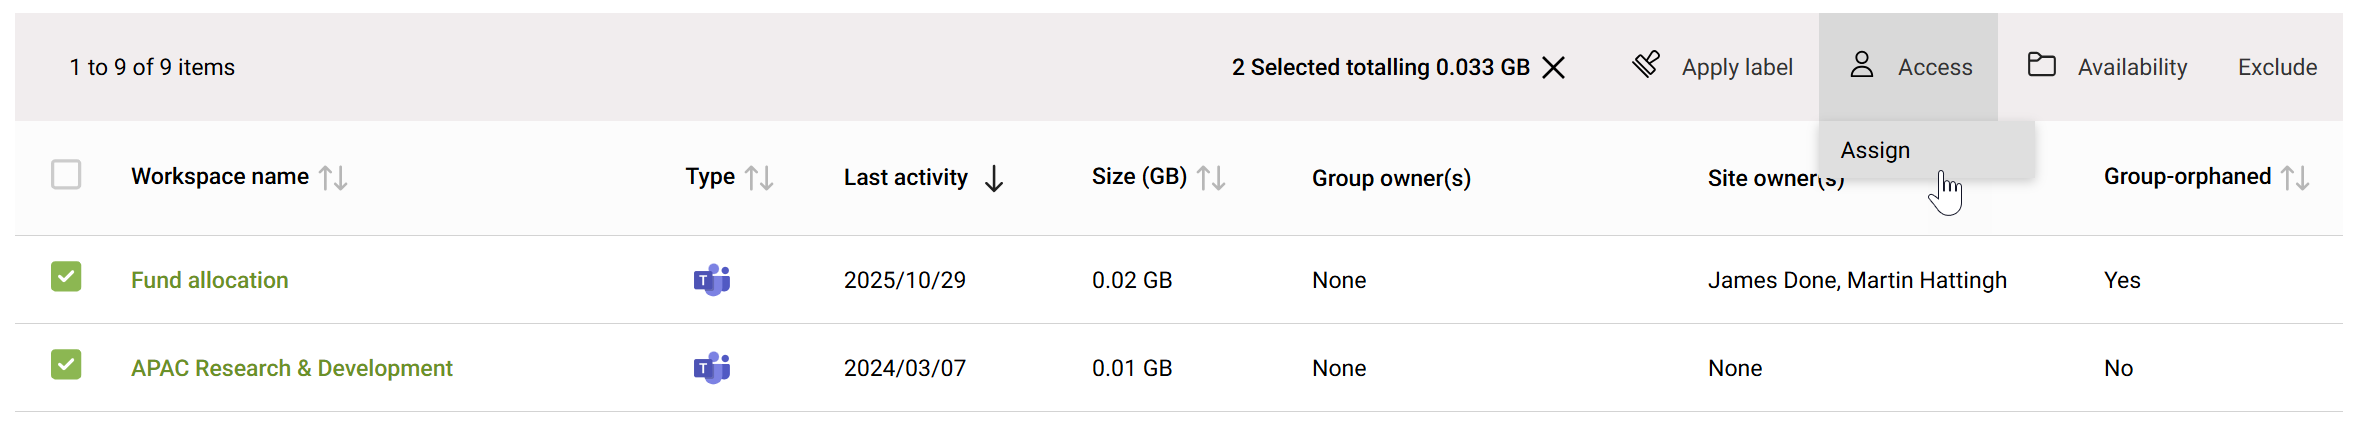
For any orphaned sites, you can easily assign ownership in bulk.
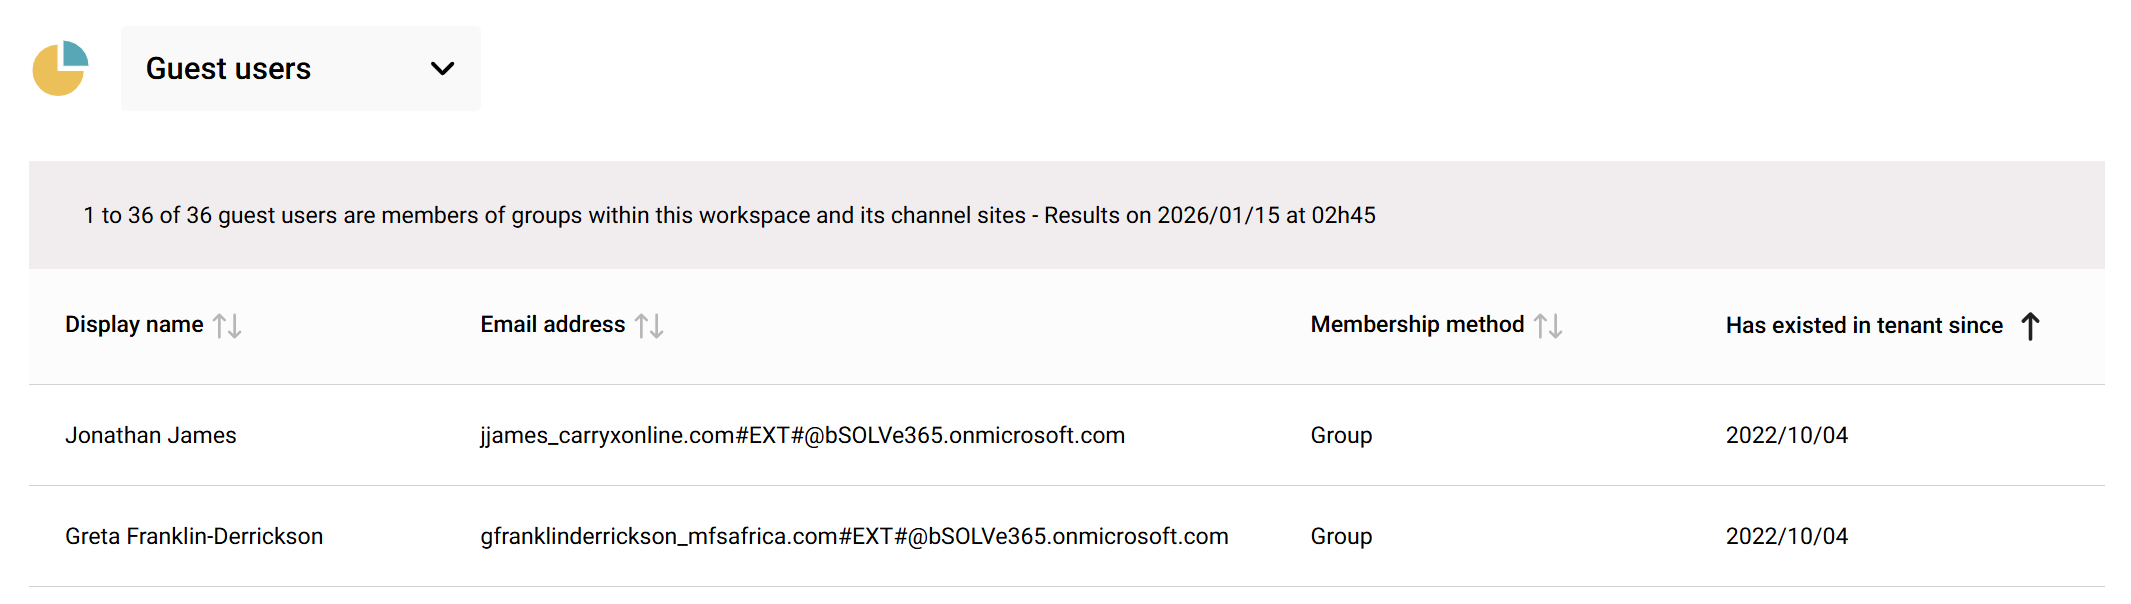
Guest User Overview
Microsoft provides detailed guest user information in the Entra ID admin center, but SharePoint-specific context is missing.
SProbot’s Health Check shows both the number of guest users and which group-connected team sites have the most guest members, and then enables drilling into sites with many guests to report on exactly who these users are.
3 - Content & Information Architecture: Visibility into Structure and ROT
Native limitations
SharePoint’s built-in reports focus on usage numbers, but they don’t tell you much about the nature of your content and how it’s organized.
Consider questions like:
- “Do we have a lot of empty or test sites?”
- “Which sites still have subsites (old architecture)?”
- “Are all our sites tied into our hub (intranet structure) or are some floating around?”
- “Do any sites have an unusually huge number of files or very large lists that could cause performance issues?”
- "Do sites contain content that should be in a different site more suited to its purpose?"
Native admin tools won’t answer these questions directly. You can manually find some info (for example, filter the Active Sites list to see sites with no hub association, if you export data to Excel), but it’s manual heavy lifting. There’s also no concept of identifying Redundant/Obsolete/Trivial (ROT) content built into SharePoint – that requires human analysis or third-party tools.
How SProbot fills the gap
The Content section of Health Check is all about understanding the composition of your SharePoint data and the structure of your tenant. It addresses a range of content governance questions.
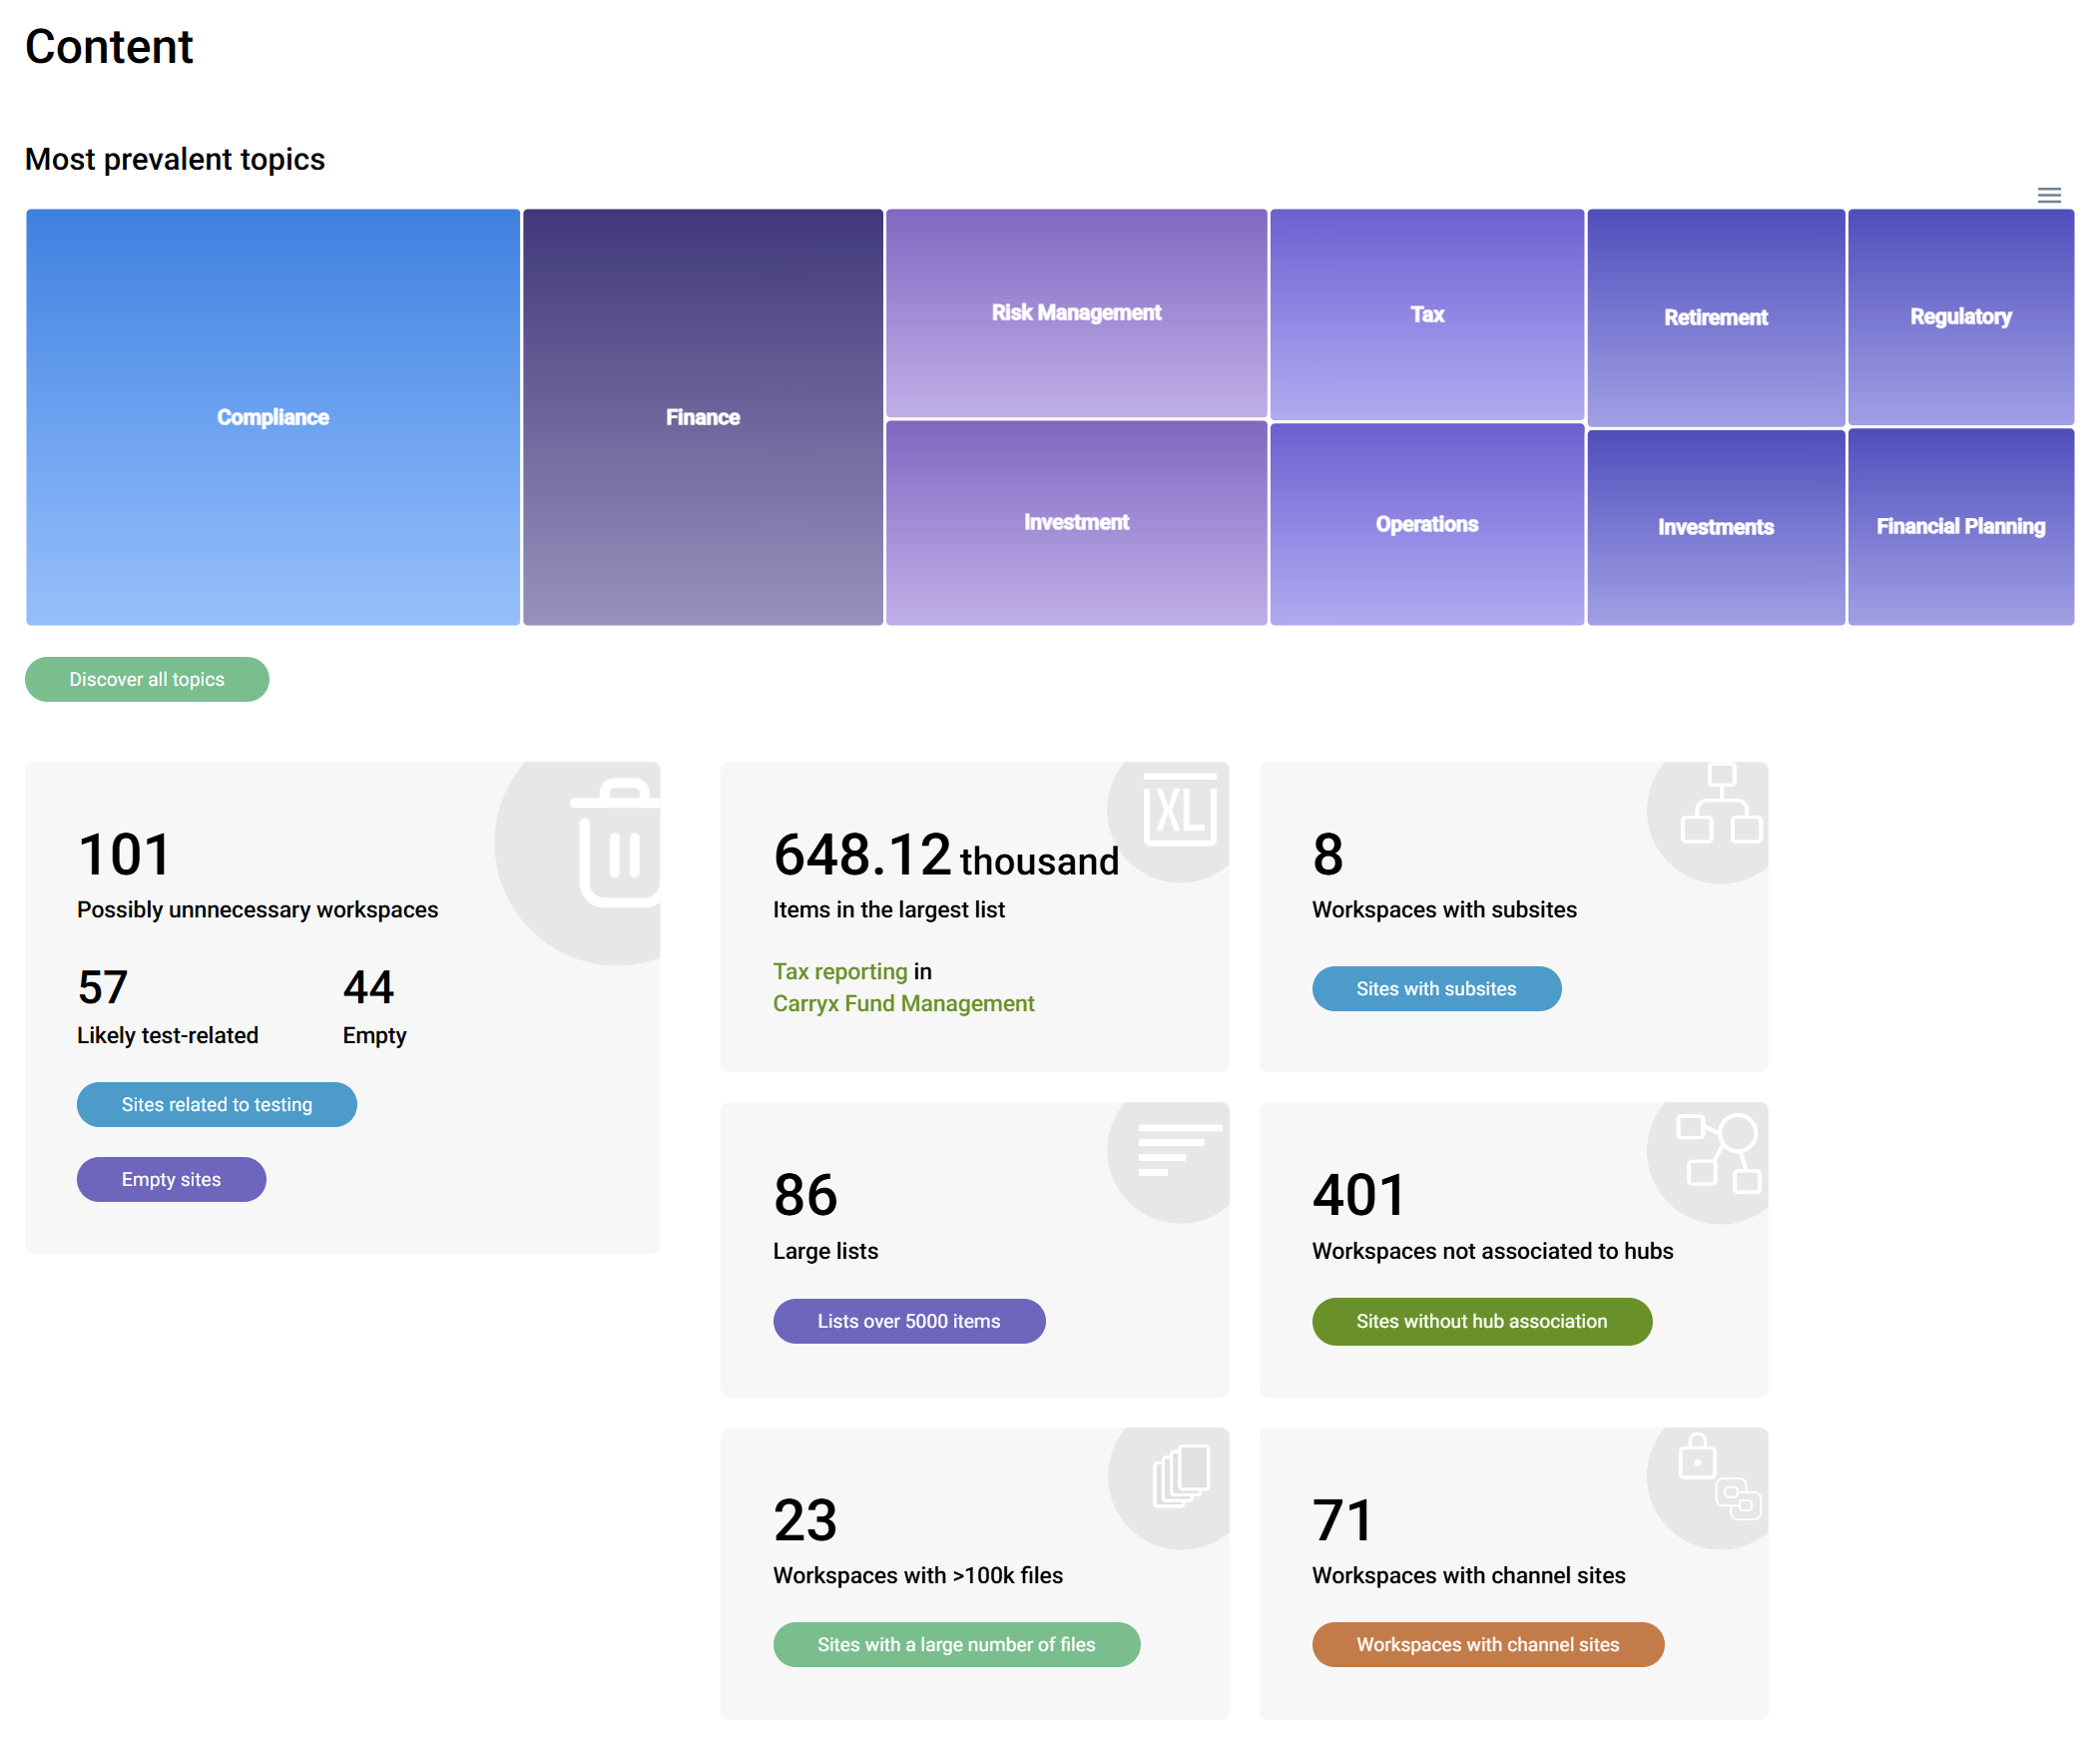
Content topics
By leveraging AI to scan sites and generate descriptions or tags, you can gain insight into which content topics are most widespread.
For example, you might learn that Project Updates or HR Policies are common across many sites, meaning those themes are heavily present. This high-level view is something SharePoint itself doesn’t provide at all.
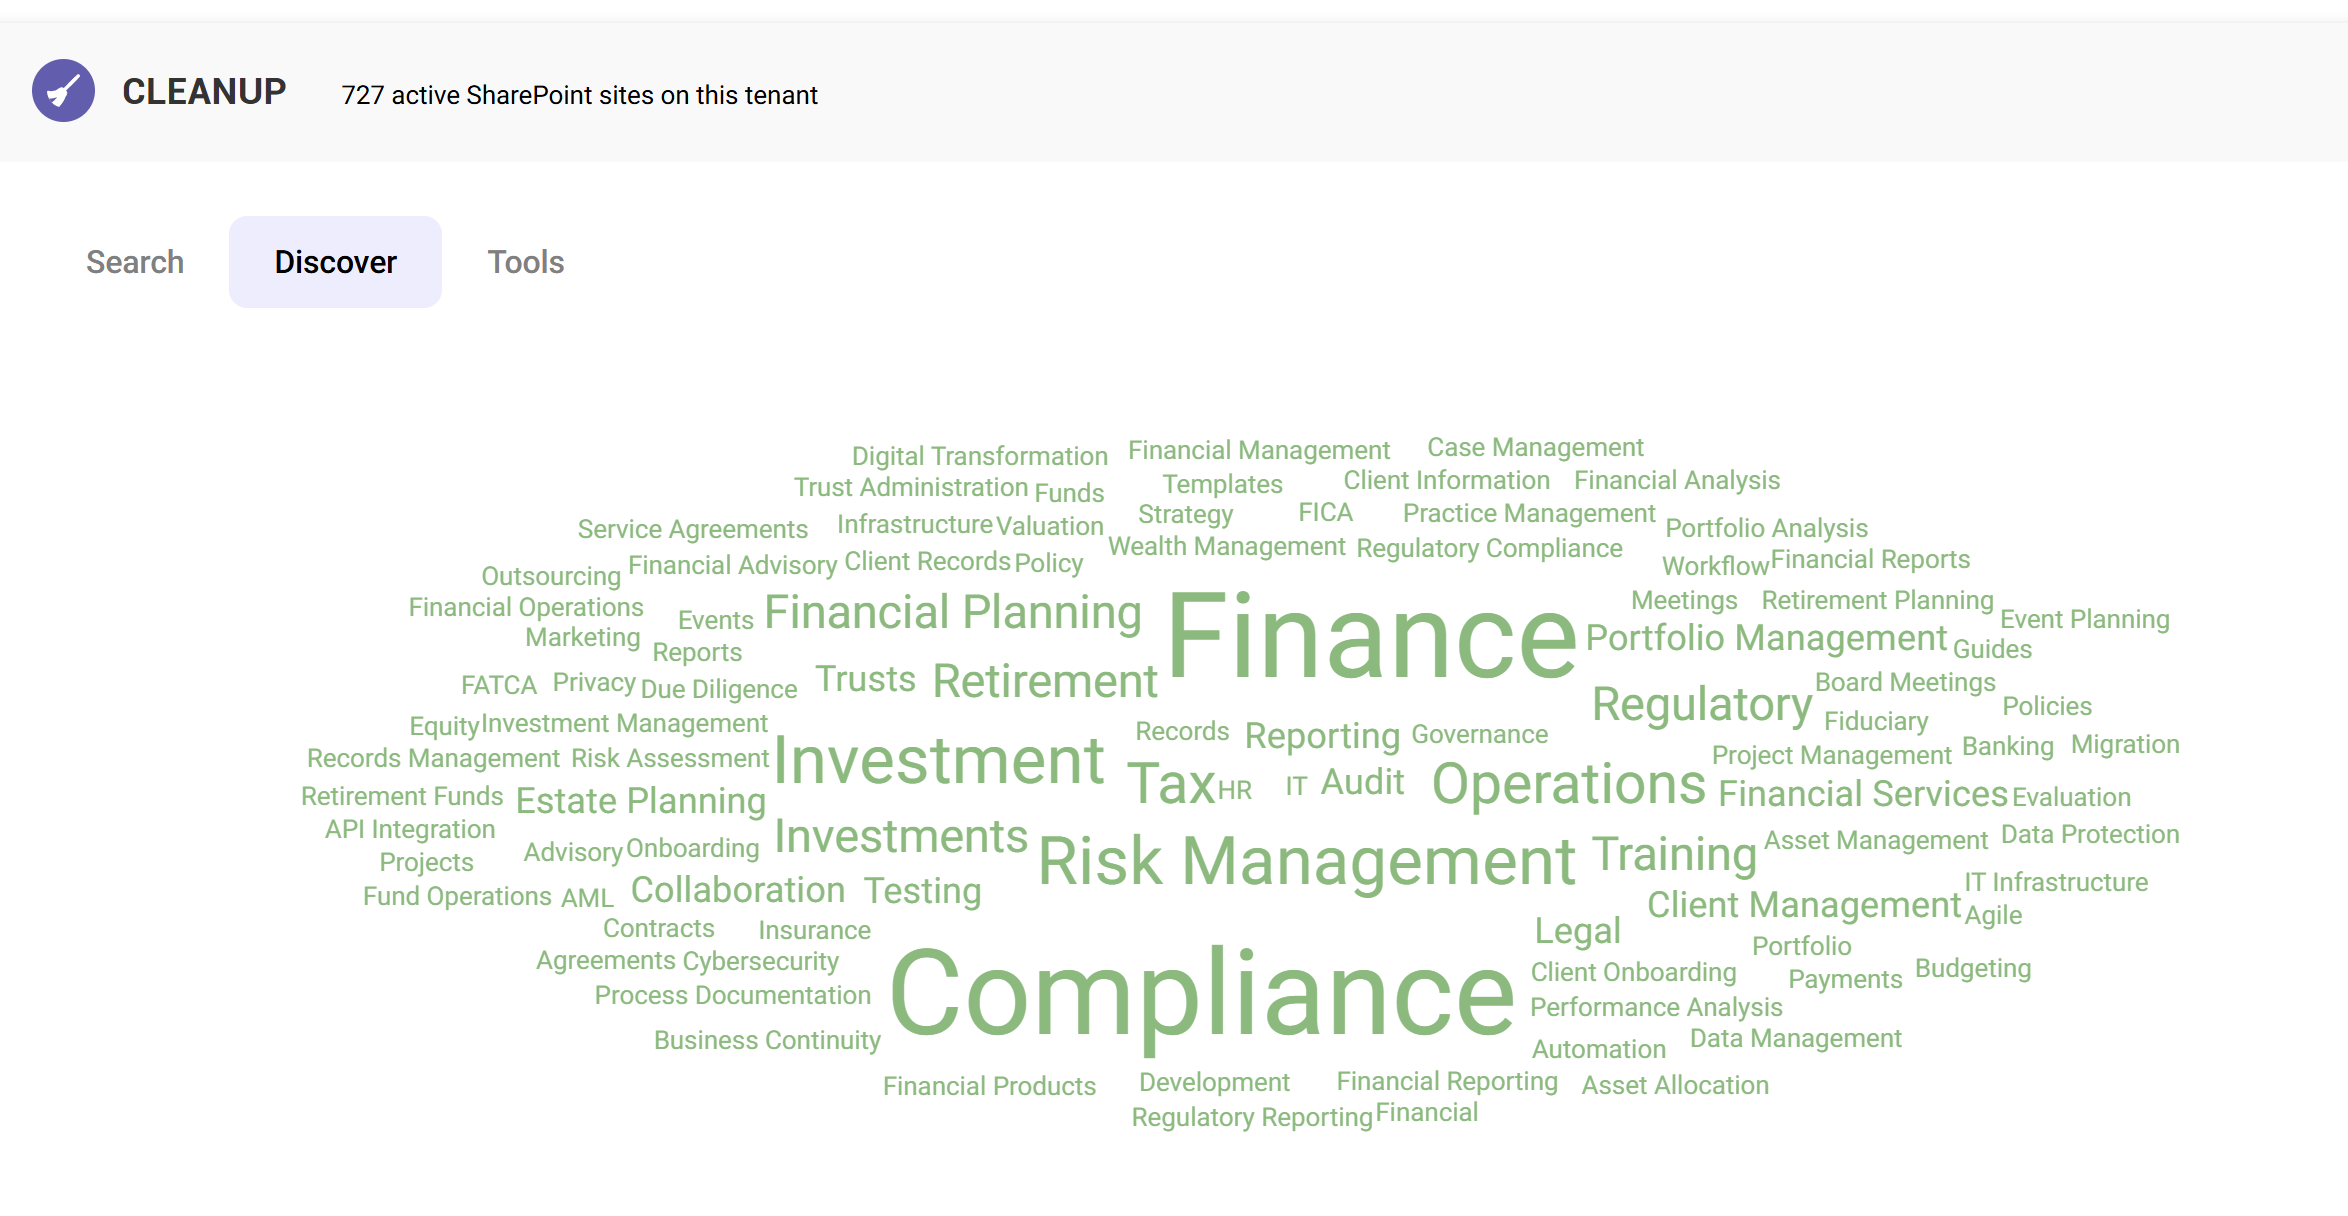
Awareness of topics enables you to take actions based on what sites actually contain, not just what users say they contain. You might for example apply a sensitivity label or assign ownership to sites which contain sensitive topics.
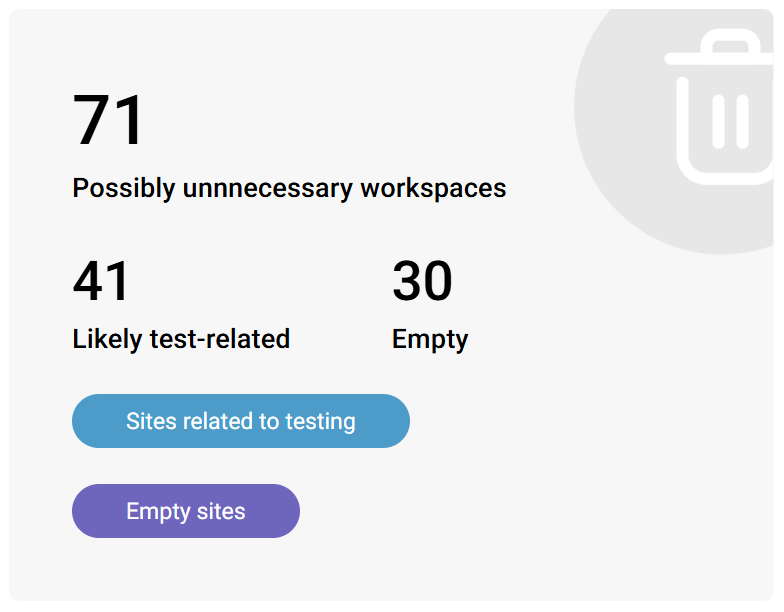
Redundant or Trivial sites
SProbot's AI assessment identifies SharePoint sites that might be redundant or trivial, such as empty sites or those clearly used just for testing. For instance, a site called “Project review" with nothing in it, or a team site that was created but no user-generated content was ever added to it, are flagged.
SharePoint Admin Center would simply list those as sites with low storage and maybe last active a long time ago, but SProbot surfaces them as potentially “redundant or trivial.” This helps you spot sites that could be cleaned up or repurposed (why keep a bunch of empty sites around?). In governance terms, it helps reduce clutter and makes search more effective because less irrelevant results are returned.
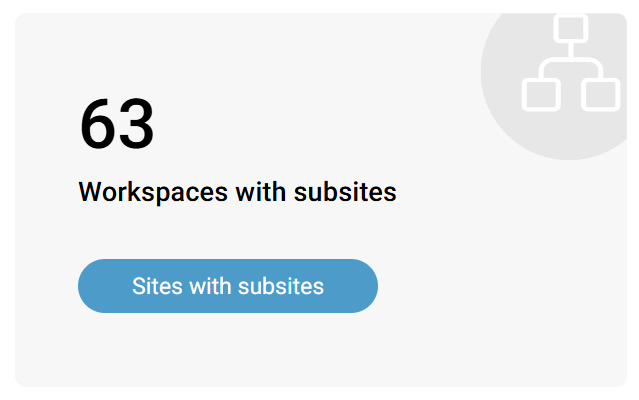
Subsites and Modern Structure
Modern best practice is to avoid subsites in favor of flat architecture. Natively, you’d have to go one-by-one or run a script to find all subsites. SProbot's health check provides easy reporting on sites which still contain subsites, enabling you to take the necessary action (e.g., break out subsites into their own site collections).
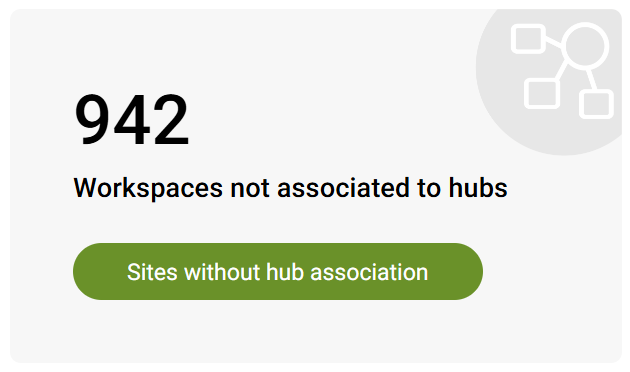
Hub association
Similarly, hubs are important for organizing sites (in SharePoint Online’s flat world). SProbot highlights if you have sites that aren't associated to hubs. Maybe you have 20 communication sites that never got attached to the corporate hub where they belong.
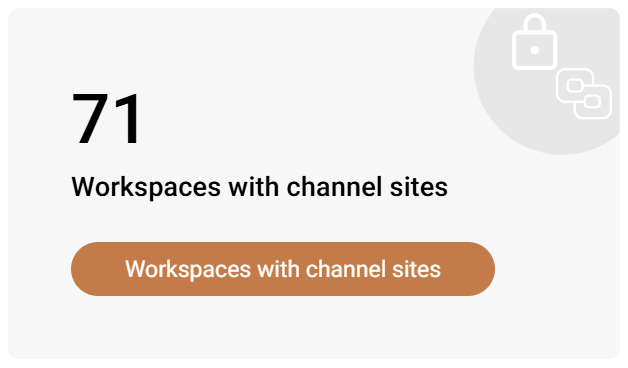
Teams with Channel sites
With Microsoft Teams, every private channel or shared channel creates a separate SharePoint site. These can sprawl and be hard to track. SProbot answers the question of "How many teams have channel sites which have separate storage implications"?
Large lists
SharePoint lists with tens of thousands of items or sites with millions of files can become difficult to manage (and potentially hit limits). SProbot provides visibility into exceptionally large libraries or lists that might require special attention (indexing, splitting up, etc). This is not something you’d see in native reports without running PowerShell scripts.
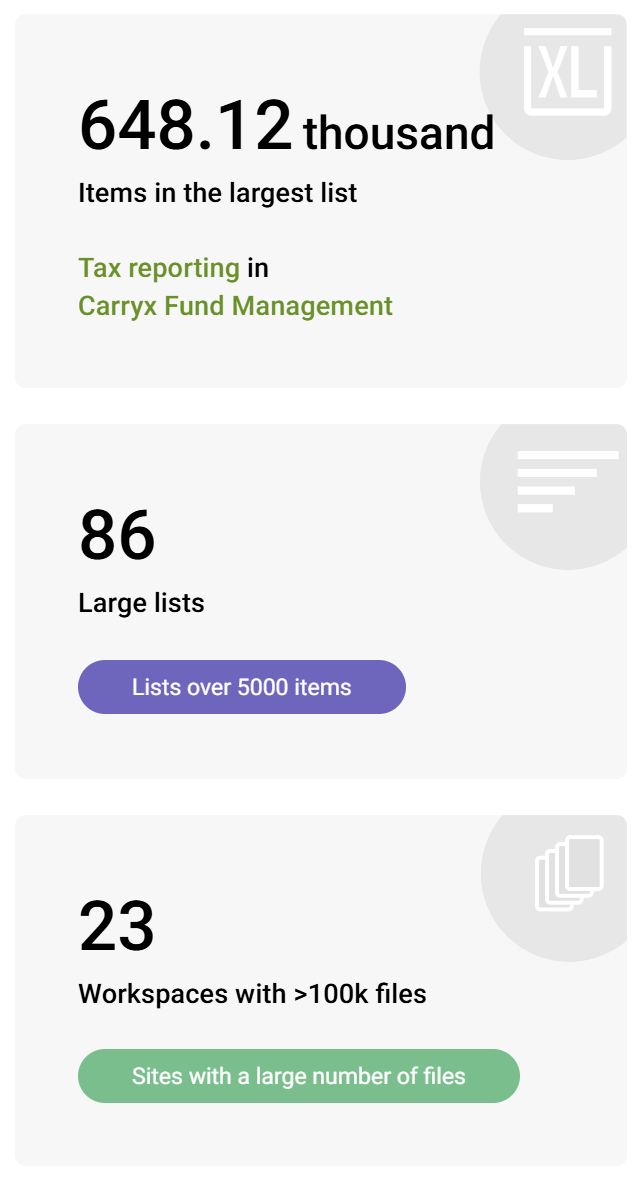
Importantly, each of these Content insights links to a detailed report of sites affected, with the ability to drill into specific sites to investigate further. This drill-down is key. Native tools might let you filter or sort a list, but SProbot’s curated lists save you time and highlight issues proactively.
4 - Activity & Lifecycle: Monitoring Usage and Identifying Inactivity
Native limitations
SharePoint provides activity data (like number of files edited, viewed, etc.) for recent periods in the Microsoft 365 admin center under Reports > Usage > SharePoint. The Activity and Site usage tabs show actions per user and site over time based on 7/30/90/180-day data.
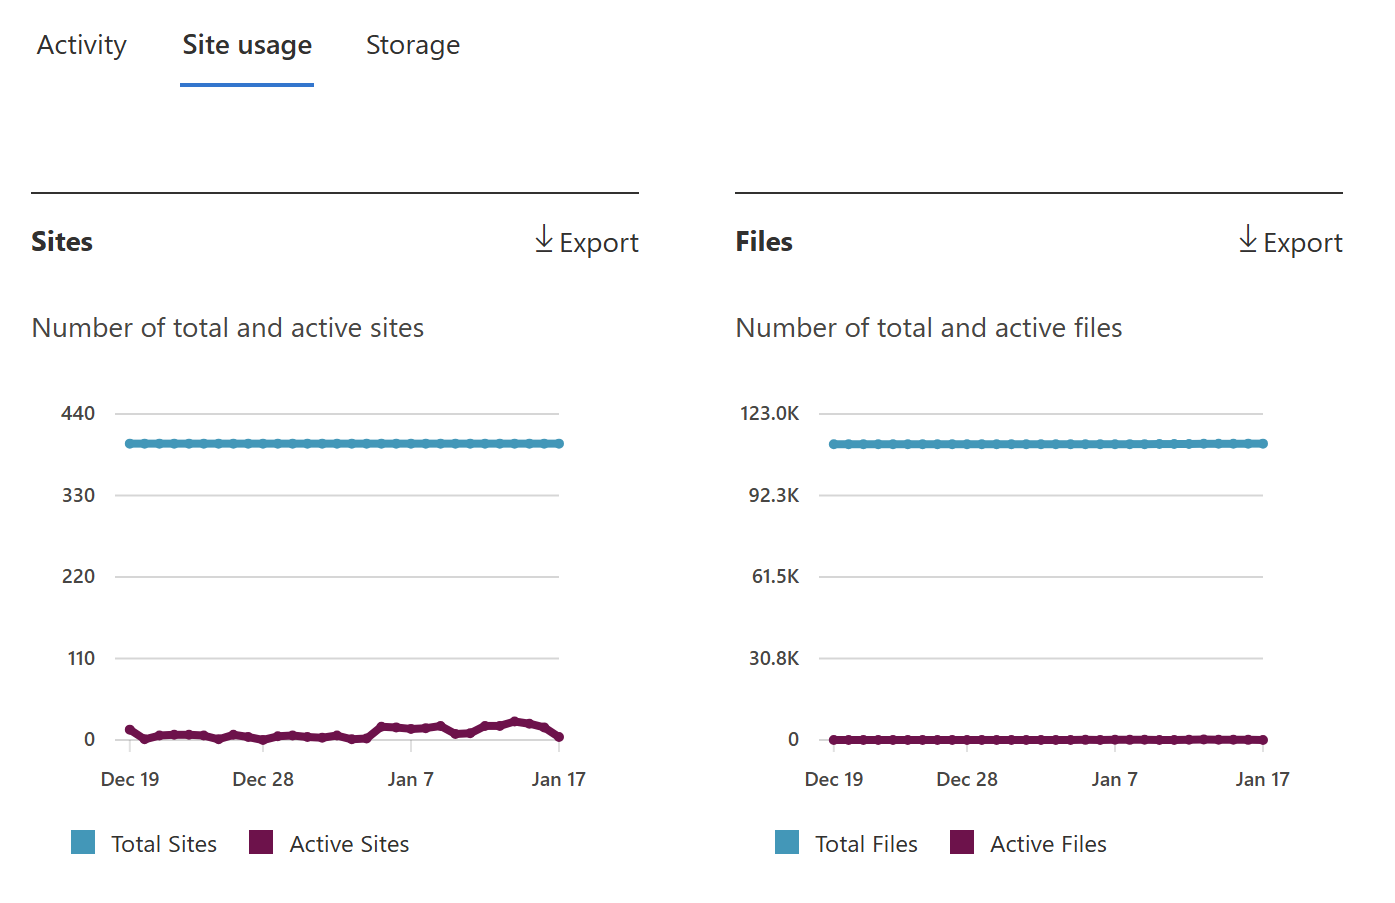
If you want to know “Which sites are mostly inactive?” the native approach would to export the Sites report to Excel and review it, but this only provides a count of figures at the top level, it does not show you which files are inactive and how much storage they consume.
How SProbot fills the gap
The Activity section of the Health check provides an overview of both site and file activity to guide you towards investigating sites which might need closer a closer look.
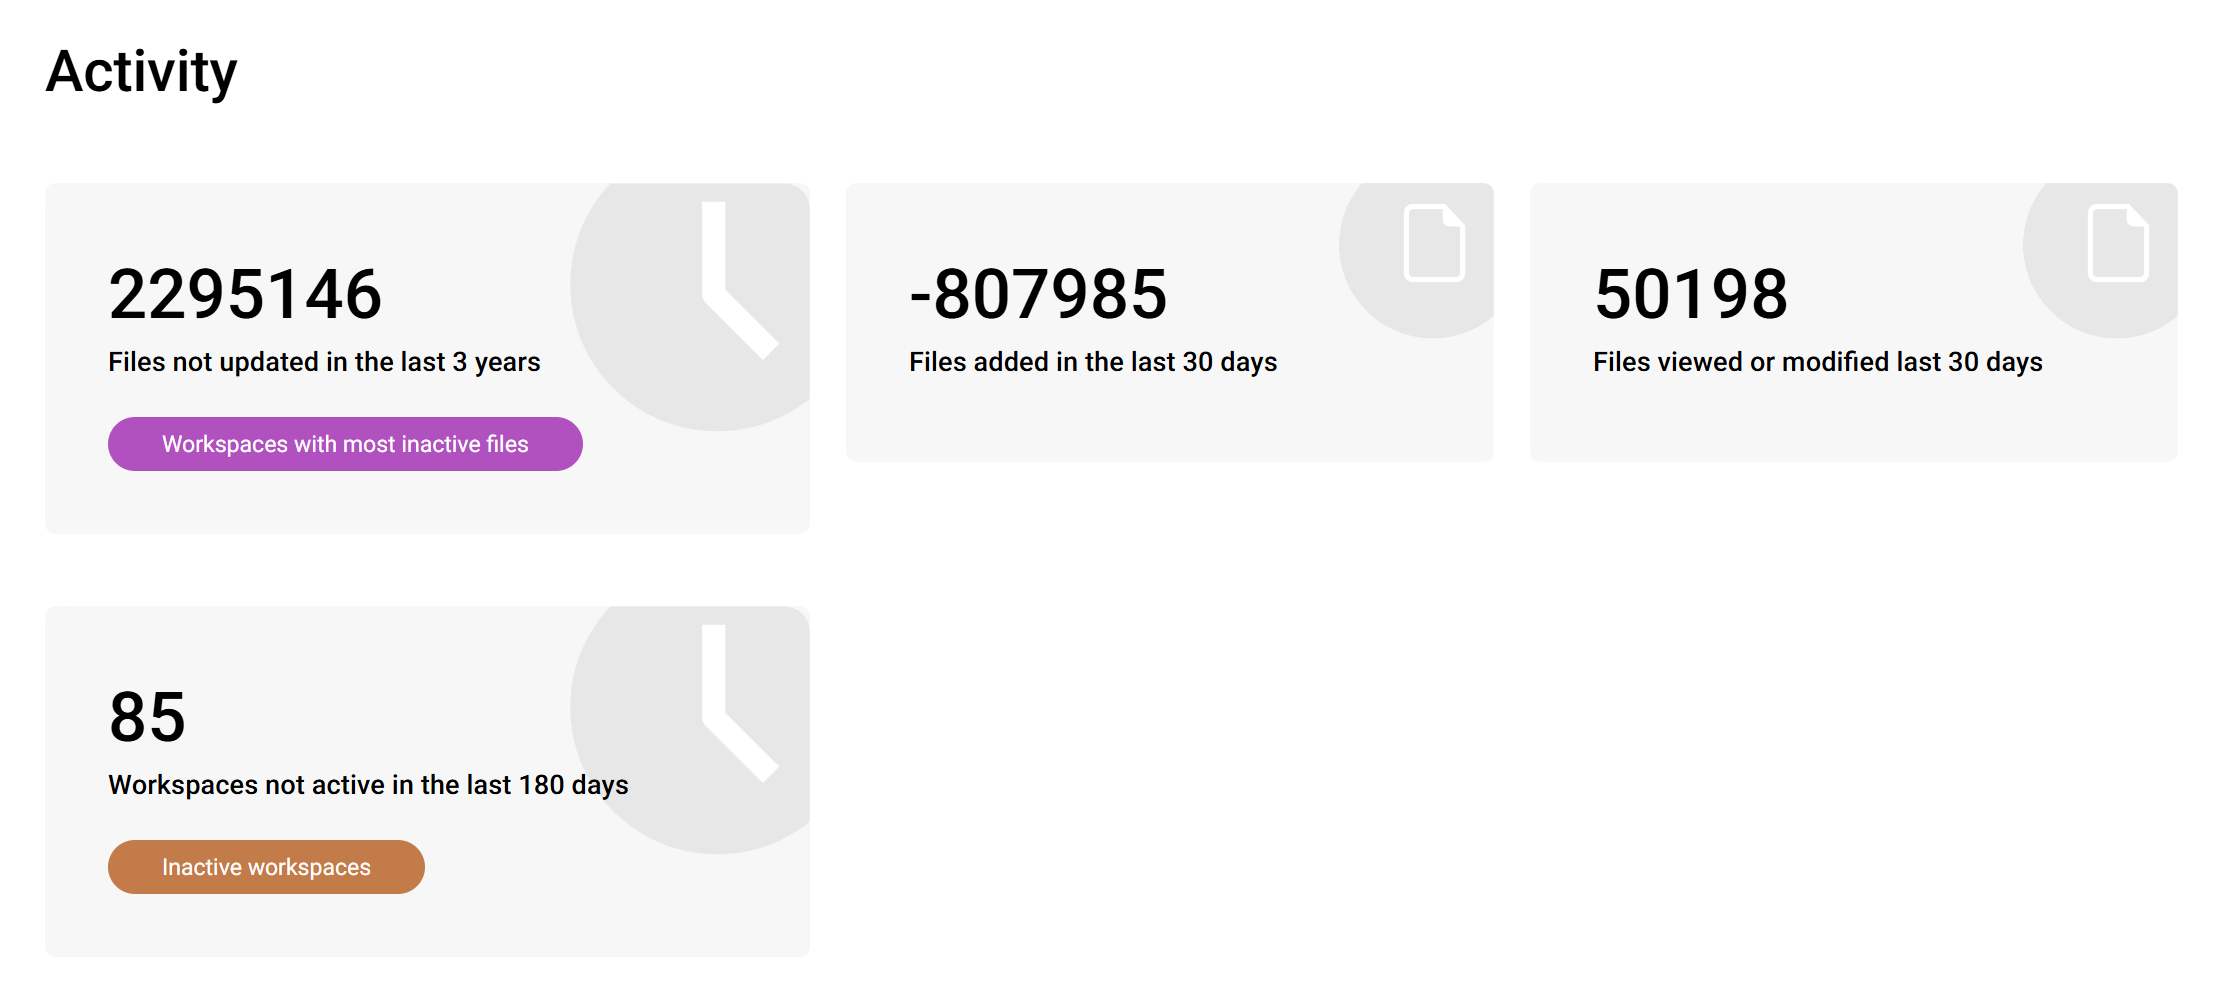
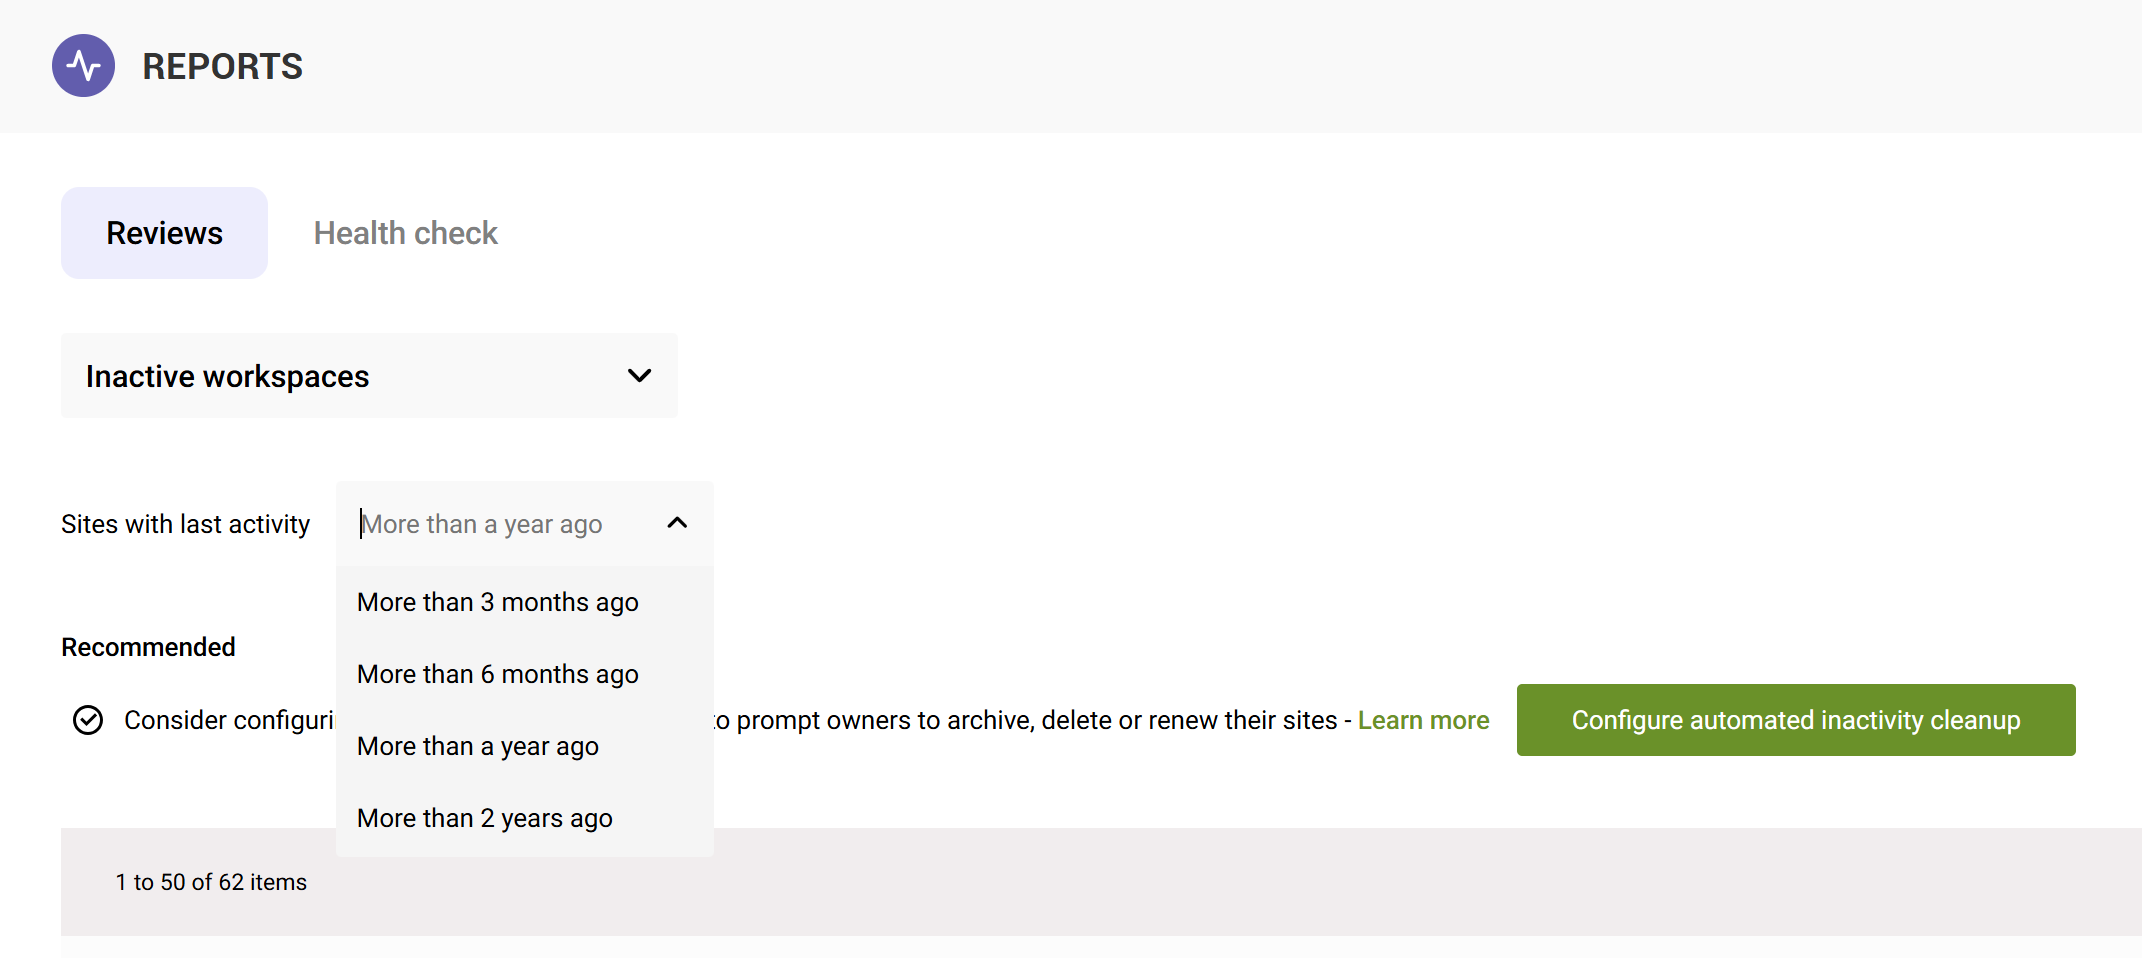
Inactive sites
The inactive sites report displays all sites with last activity older than a year, with the ability to filter on different thresholds.
File activity
The Health Check also shows overall content activity, specifically highlighting sites which have a high percentage of inactive files, with the ability to view different thresholds (inactivity for 25%, 50% or 75% of files).
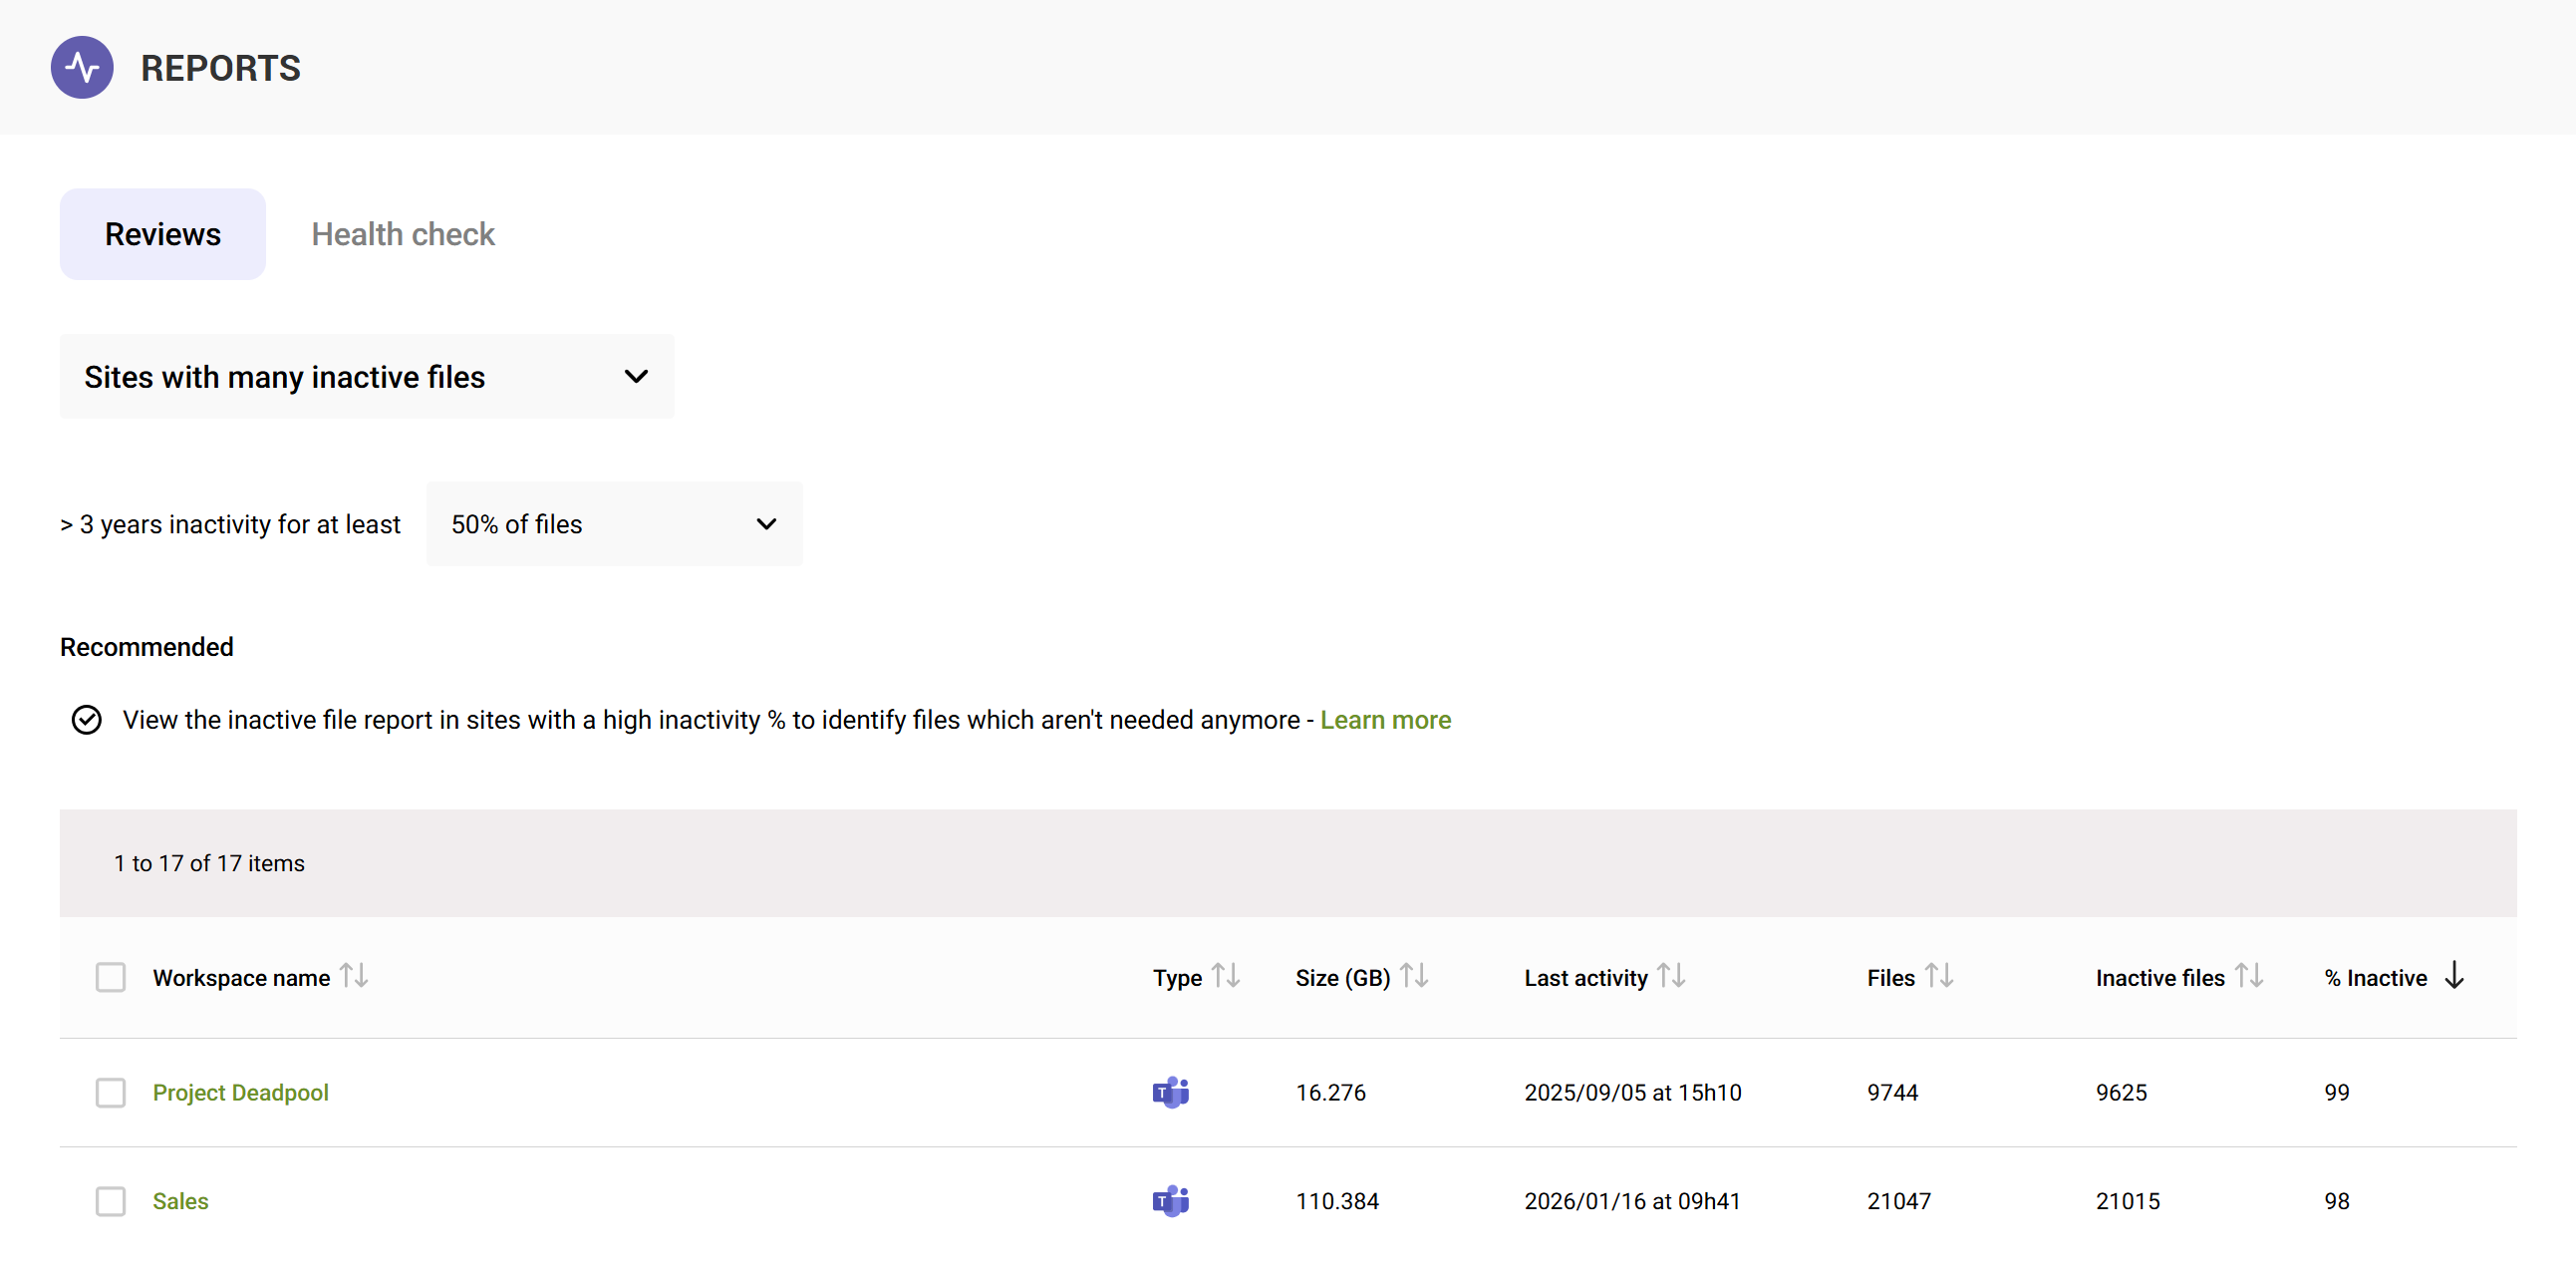
SProbot then fills the gap in the native reporting capabilities by enabling you to drill into file-level specifics. You can view detailed file-level activity reports and take actions on files directly, as illustrated in the next section.
5 - Reporting at file level
Inactive files
Once you’ve identified a site with a large percentage of inactive content, you can go into details with the Inactive Files report for that site. This report lists all files not modified in over X years (you can adjust the threshold at tenant crawl level to 3, 5 or 7 years).
You might find, for example, that a site has 500 PDFs not modified in 3 years, totaling 100 GB.
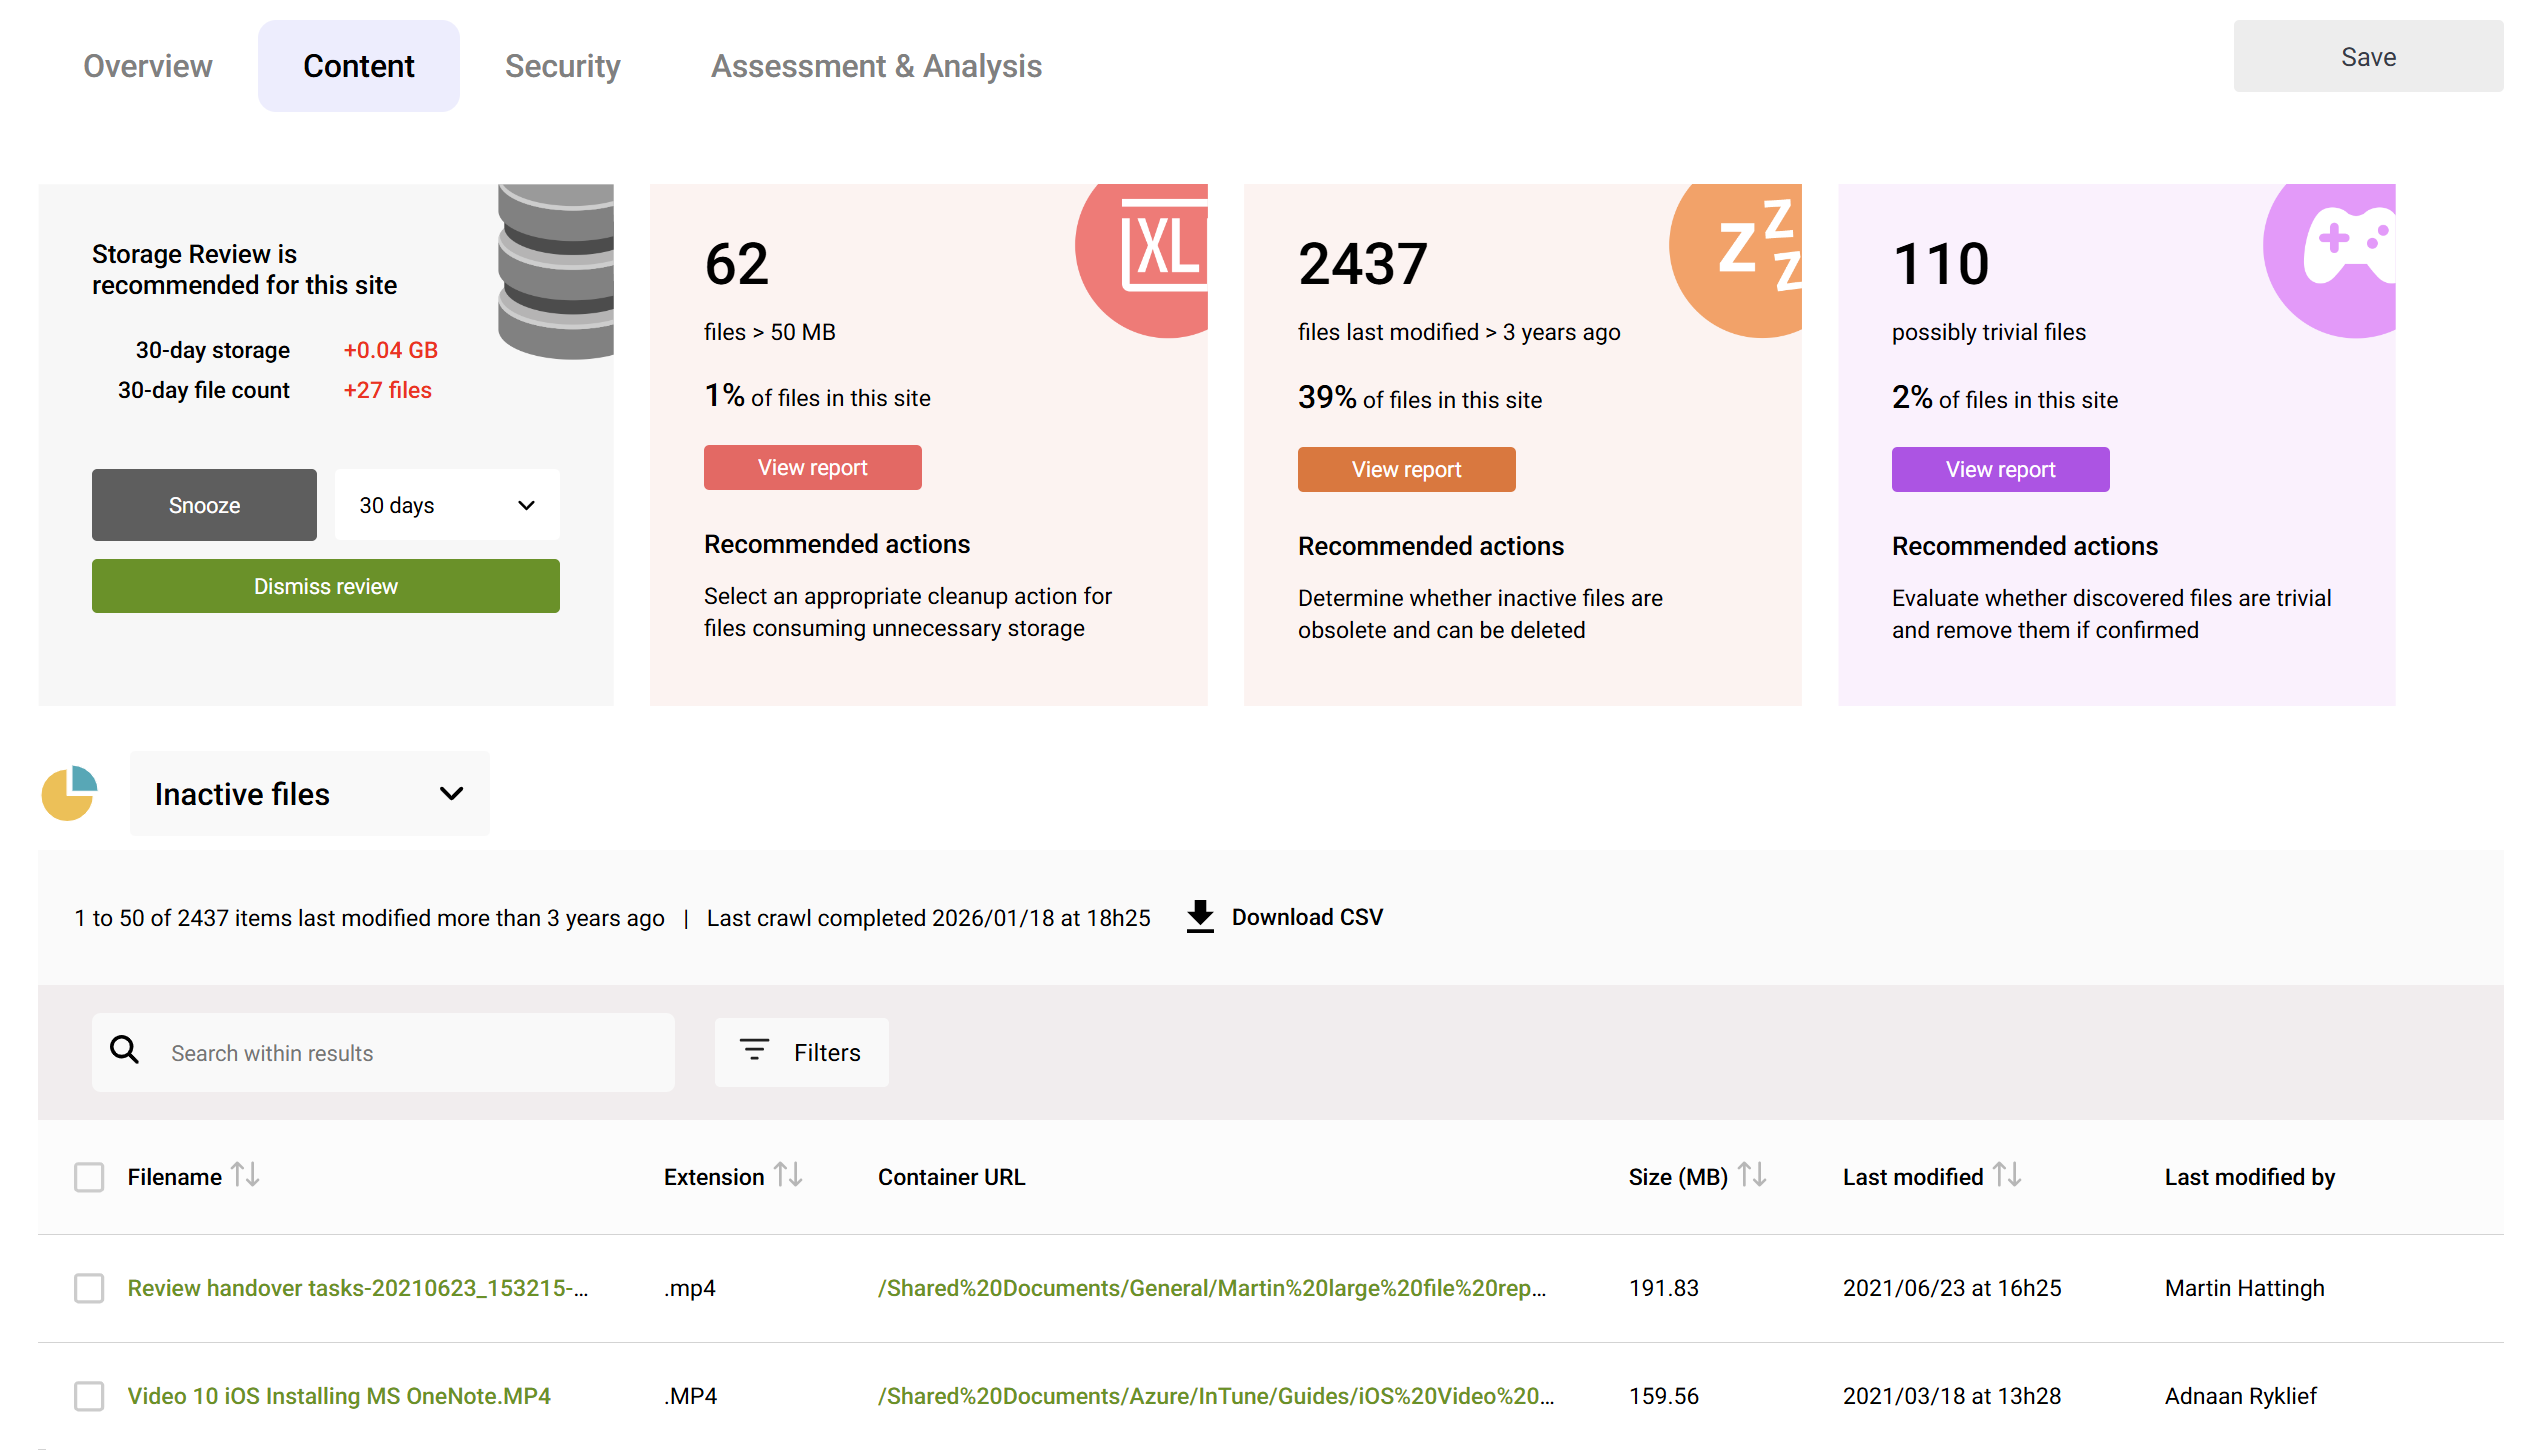
You can also search and filter within results to find files matching specific criteria, such as those last modified by a specific person, within a specific date range, with a specific extension, or larger than a certain size threshold.
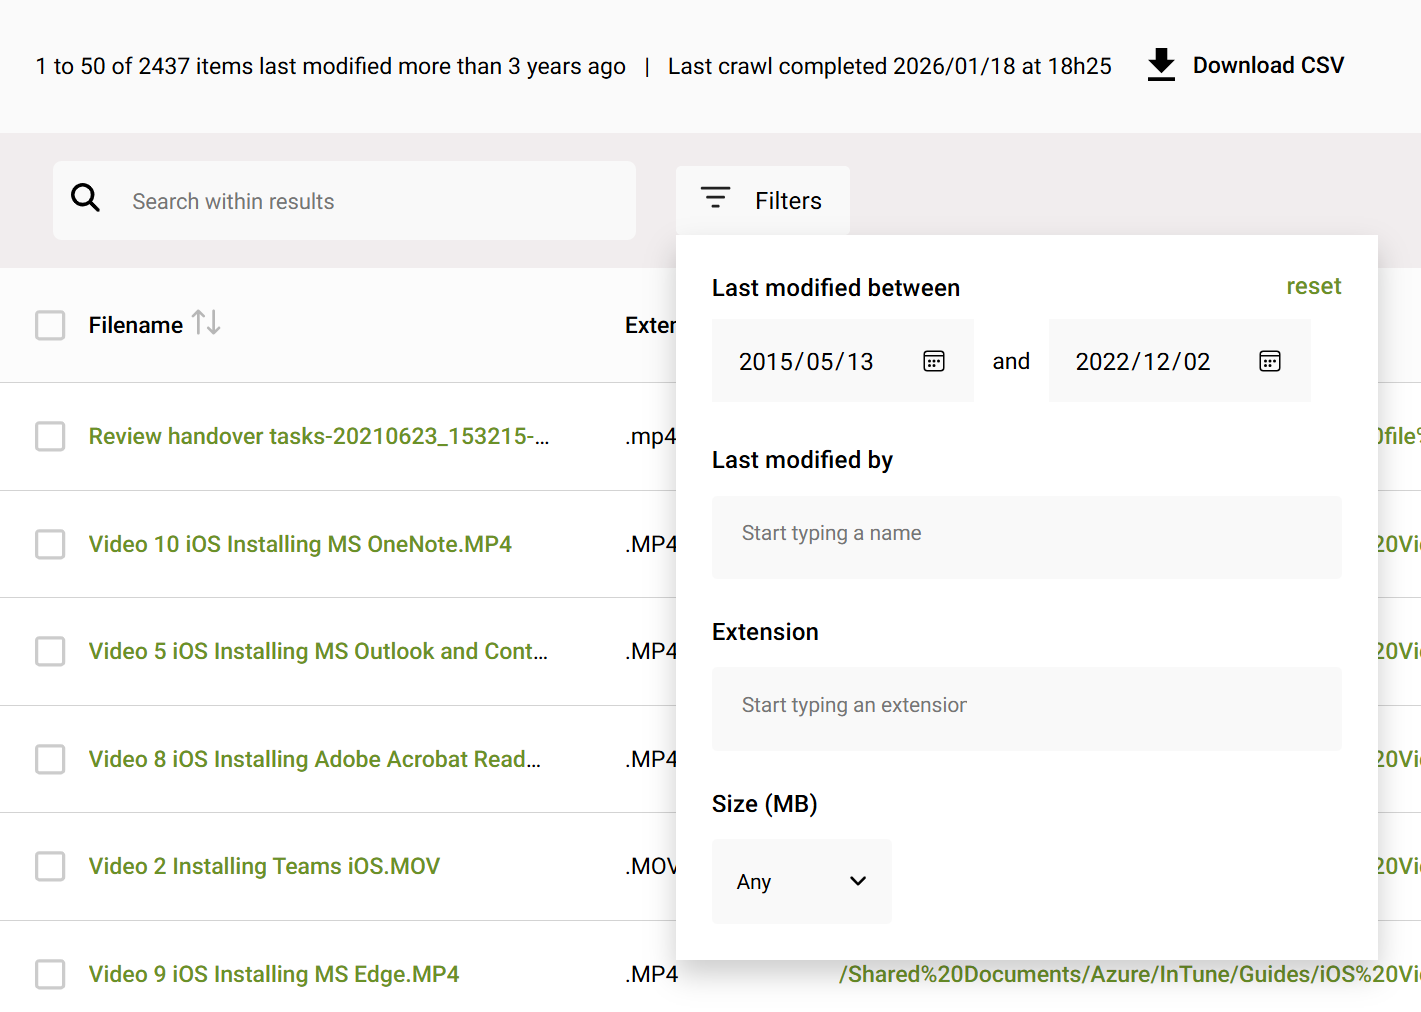
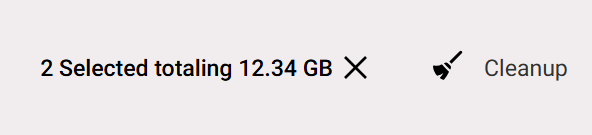
You can then export the results to a report to CSV to enable more detailed analysis, and if further action is needed, files not actively needed can be moved to an archive site, or deleted entirely using the Cleanup button.
Without SProbot, you’d have to run a PowerShell script get such a list of files, or use a search query with limited refinement and then manually compile results and manually take action (or automate actions using PowerShell or Power Automate).
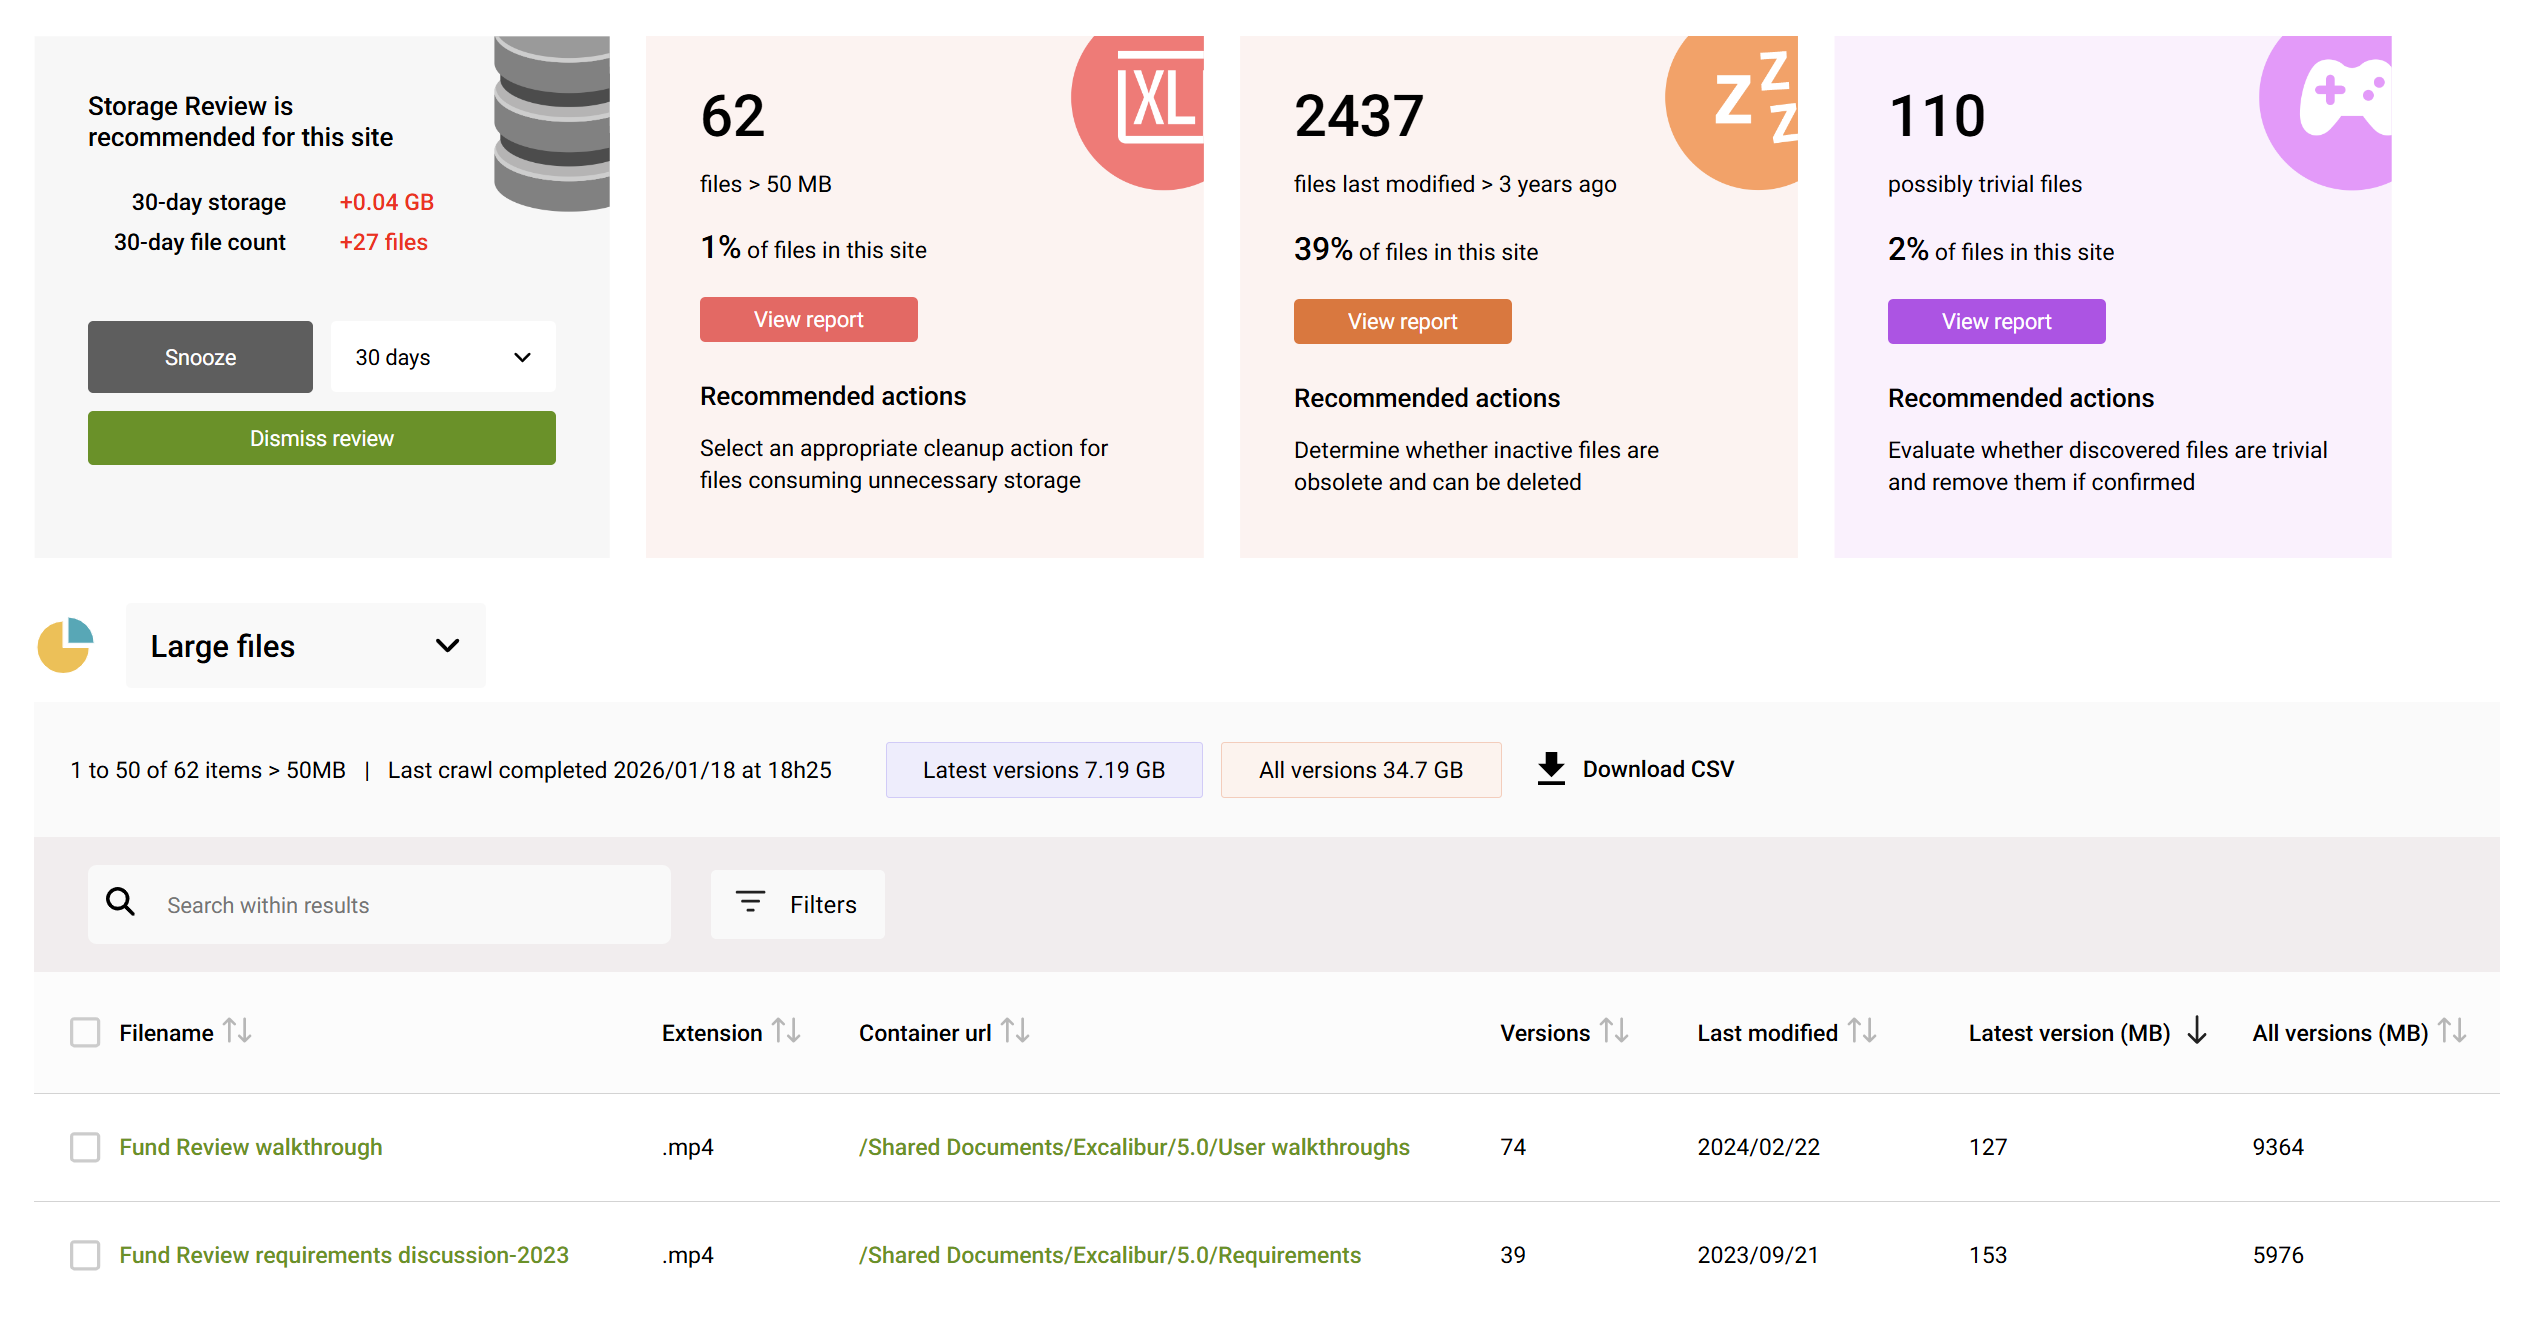
Large files
Similarly to how you can report on inactive files in a site, SProbot provides detailed information on large files (over 50MB) which consume storage. In addition to just basic file information, the SProbot crawl engine also automatically retrieves versioning data for large files. This enables reporting on how much storage is consumed by older versions vs latest versions, and enables you to make decisions on trimming to free up space.
In the example below:
- There are 62 files larger than 50MB
- The latest versions of these files total 7.19GB, but all versions total 34.7GB.
This means that there is 27.51GB of potential savings if only the latest versions of all these files are retained.
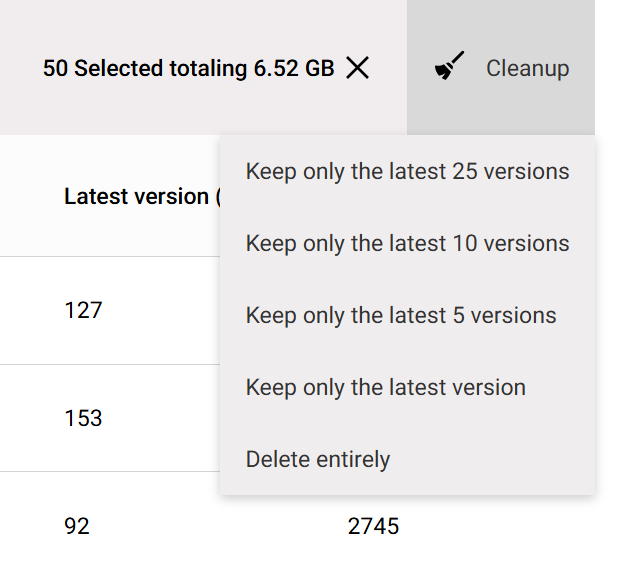
When you've identified files with versions which consume storage excessively, you can select them and run version trimming cleanup by opting to keep the latest 25, 10, or 5 versions (or only the latest version if you wish). You can even delete them entirely if you've determined that they are unnecessary.
Why is all this additional reporting valuable?
Relying solely on native SharePoint reporting is like trying to complete a puzzle with half the pieces. You might have storage numbers and user activity charts, but you lack the context of where problems lie and how to fix them. SProbot completes that puzzle by providing the missing pieces: comprehensive visibility and guided actions.
With SProbot’s Health Check and Reviews, you can quickly assess the overall state of your SharePoint environment.
- Know if storage growth is outpacing expectations, and which sites are culprits.
- See if external sharing is under control or if there are risk hotspots that need tightening.
- Detect if your content is getting stale, and exactly where the digital cobwebs are.
- Have confidence that no empty, unmanaged or forgotten sites are falling through the cracks.
Perhaps most importantly, this integrated approach means you’re not just aware of issues – you’re empowered with tools to resolve them efficiently.