How to use the Dashboard and Health Check
Understanding the state your SharePoint Online environment is the first step in proactive management. SProbot's Health Check provides a holistic snapshot of your tenant’s state – covering storage, security, content, and activity – so you can identify potential issues before they become major problems. In this guide, we’ll cover the metrics reported by the Health Check, how it relates to the Dashboard, why these metrics are important, and how you can use them to start reviewing and cleaning up content.
1. Why a health check is important
SharePoint environments can become increasingly complex over time. As content accumulates, new sites are created, and permissions are frequently altered, maintaining oversight becomes challenging. Without regular health checks, admins risk losing sight of critical indicators such as storage capacity, overshared content, or inactive sites. Minor issues can escalate; for instance, unchecked growth in a few sites might exhaust your storage quota, or a neglected site with outdated content and broken permissions could pose a security risk.
What's the difference between the Health Check and Dashboard?
The Health Check displays a full set of metrics, the Dashboard provides headline counts of the most common ones.
2. Metric categories covered by the Health Check
To help you address your specific concerns, metrics are grouped into Storage and Growth, Security, Content, and Activity.
2.1 Storage and Growth
How much storage is being used? What are the largest sites or repositories? Are there sites growing unusually fast? The Storage section enables you t o
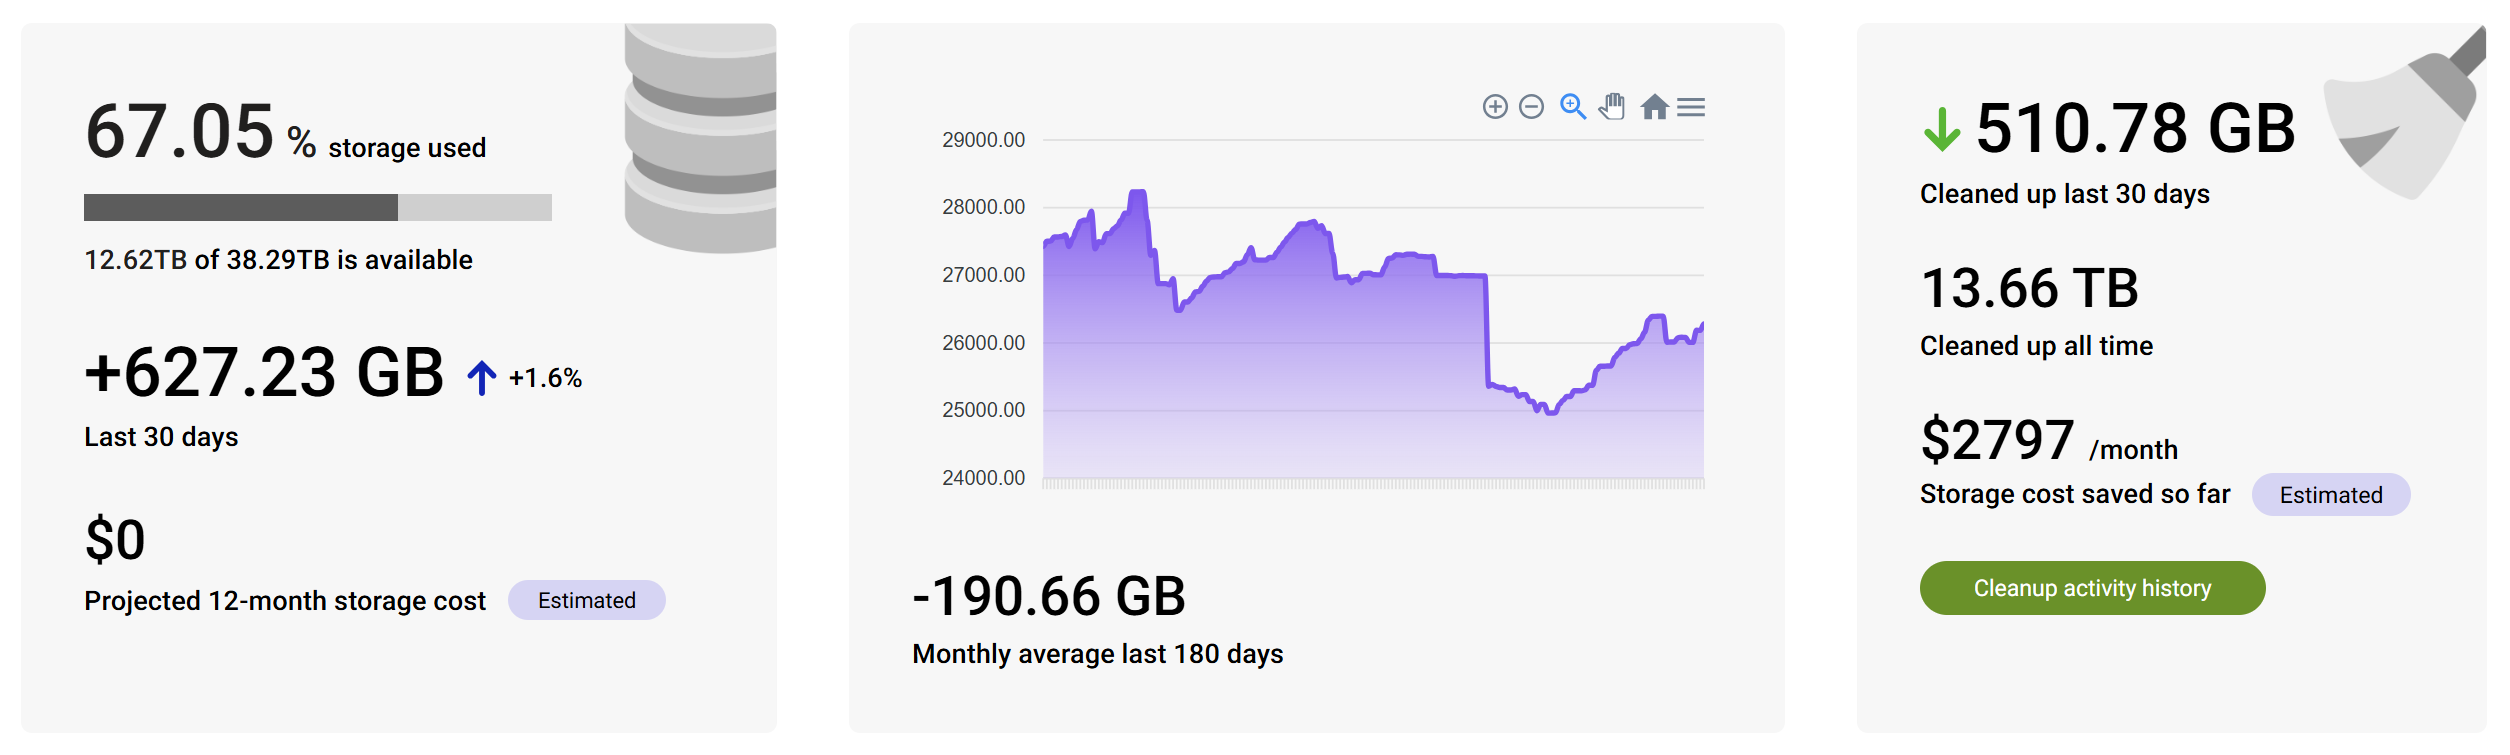
2.1.1 Core storage metrics
The first metrics under Storage are the core tenant-wide figures, which show you:
- Storage used and remaining.
- GB growth for the last 30 days.
- Projected storage cost for the next 12 months, calculated on your tenant base allocation plus average growth extrapolated from the last 6 months.
- Monthly average over the last 180 days.
- A detailed 6-month graph which you can zoom into to view granular periods, or export.
- How much storage has been saved with SProbot's cleanup actions over the last 30 days, in total, and the cost of these savings. You can click through to the tenant's full cleanup activity history from here.
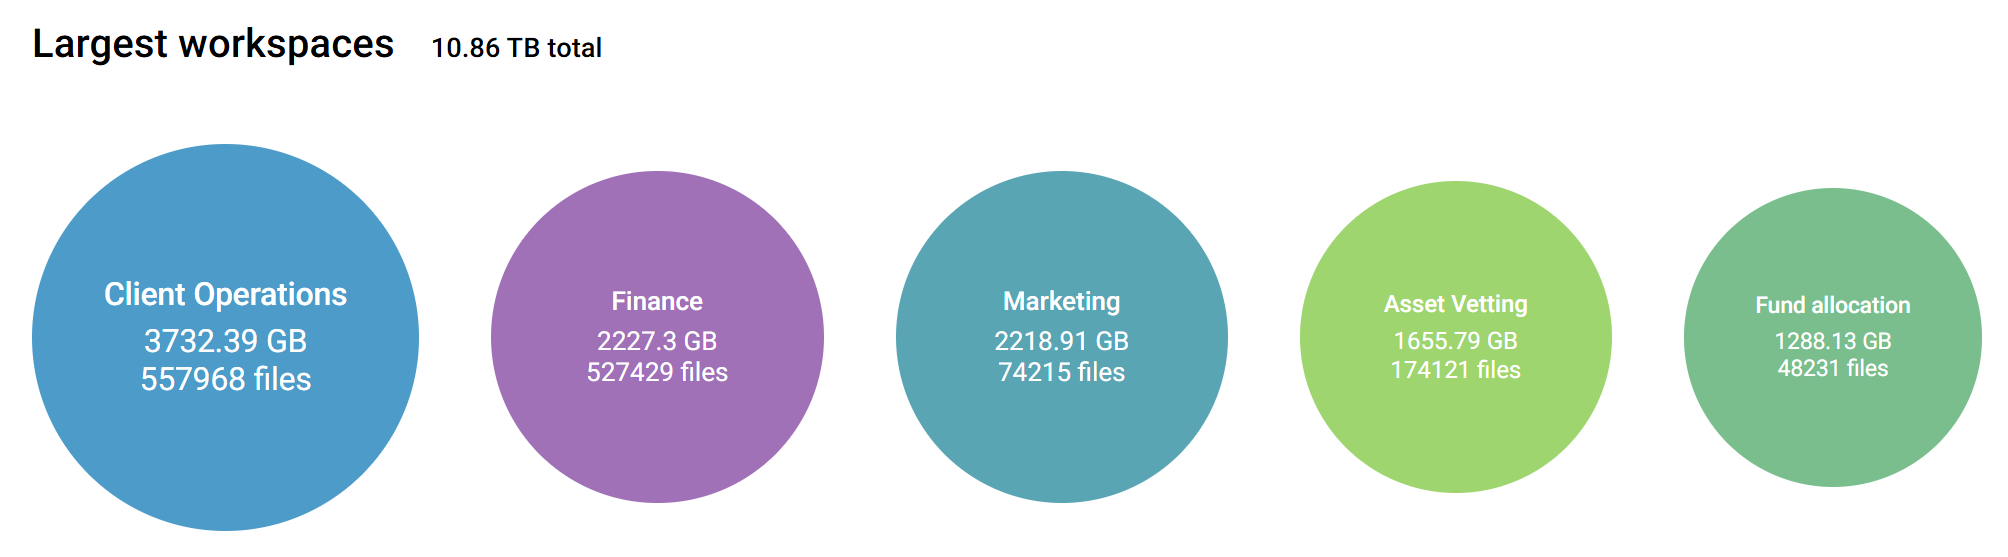
2.1.2 Largest sites
You can see the largest sites by storage consumed (GB) and file count, in descending order.
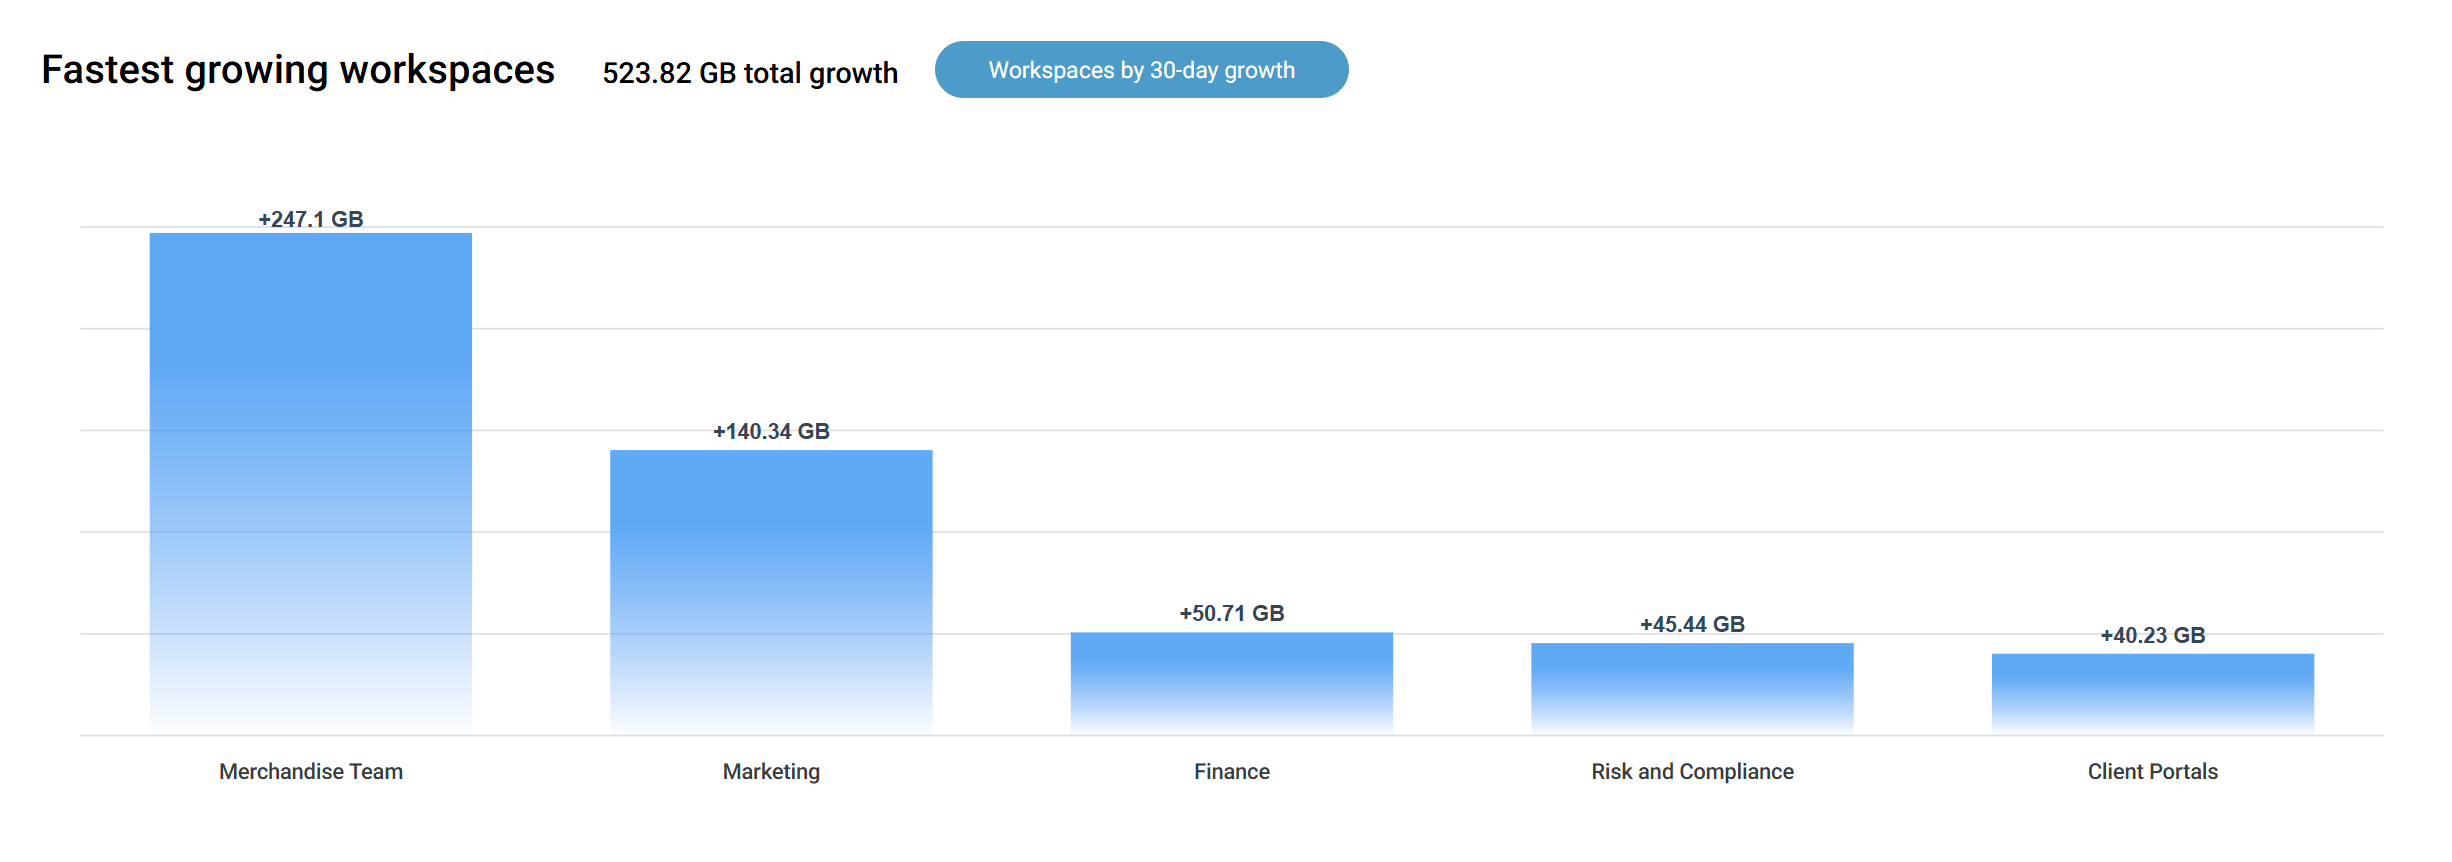
2.1.3 Fastest growing sites
The fastest growing sites are displayed by storage (GB) increase over the last 30 days. You can click through to the Workspaces by 30-day growth review to see a report of individual sites with more granular figures.
Note: You need to have been indexing your tenant with SProbot for at least 30 days to see data displayed here.
2.1.4 Tenant-wide large file version consumption
This metric displays the total storage consumed by large files (defined as files >50MB latest version) across all sites in the tenant, with detail on how much is consumed by latest versions of documents in comparison to all other versions.
From here, you can click through to the Workspaces with large files review to view a more detailed report on all sites that contain large files, and from there manage and clean up versions within specific sites.
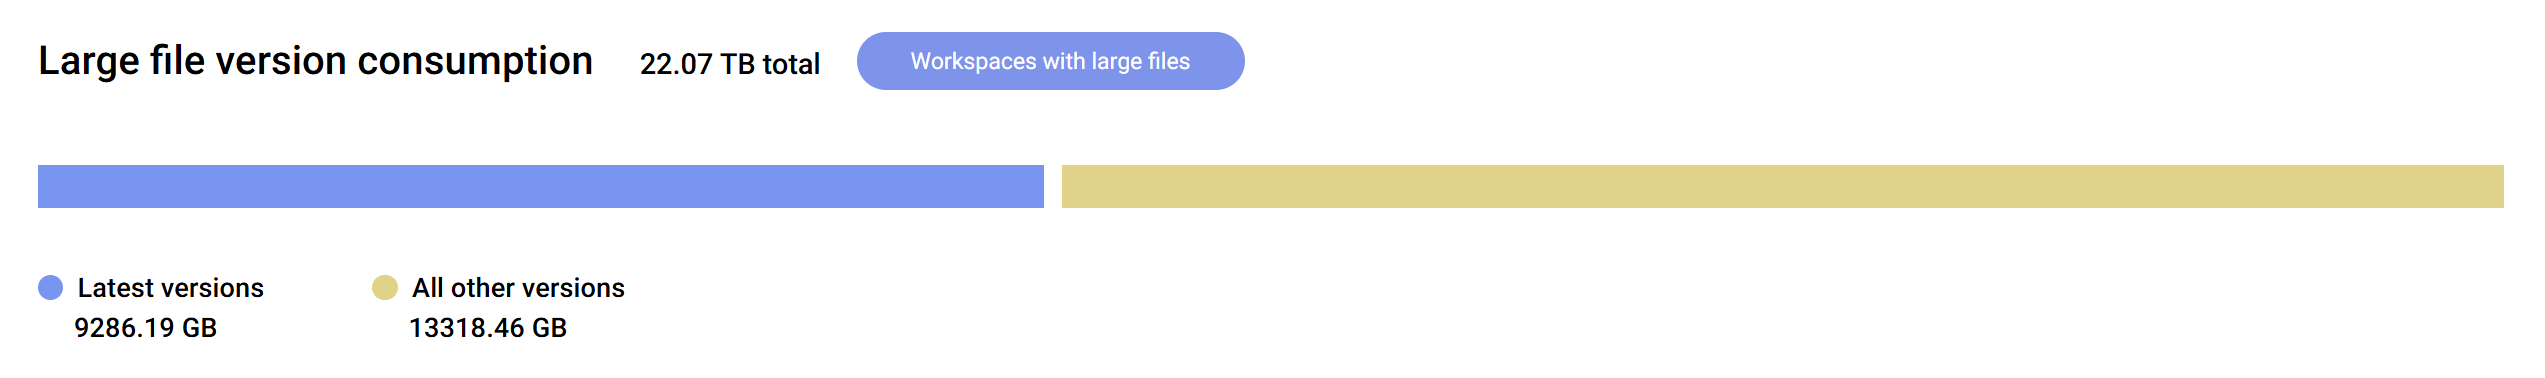
This metric can be used to quickly determine how much storage can potentially be saved (and costs saved) by version trimming.
2.2 Security
Security metrics are divided into sharing links, sharing settings, ownership, and guest users.
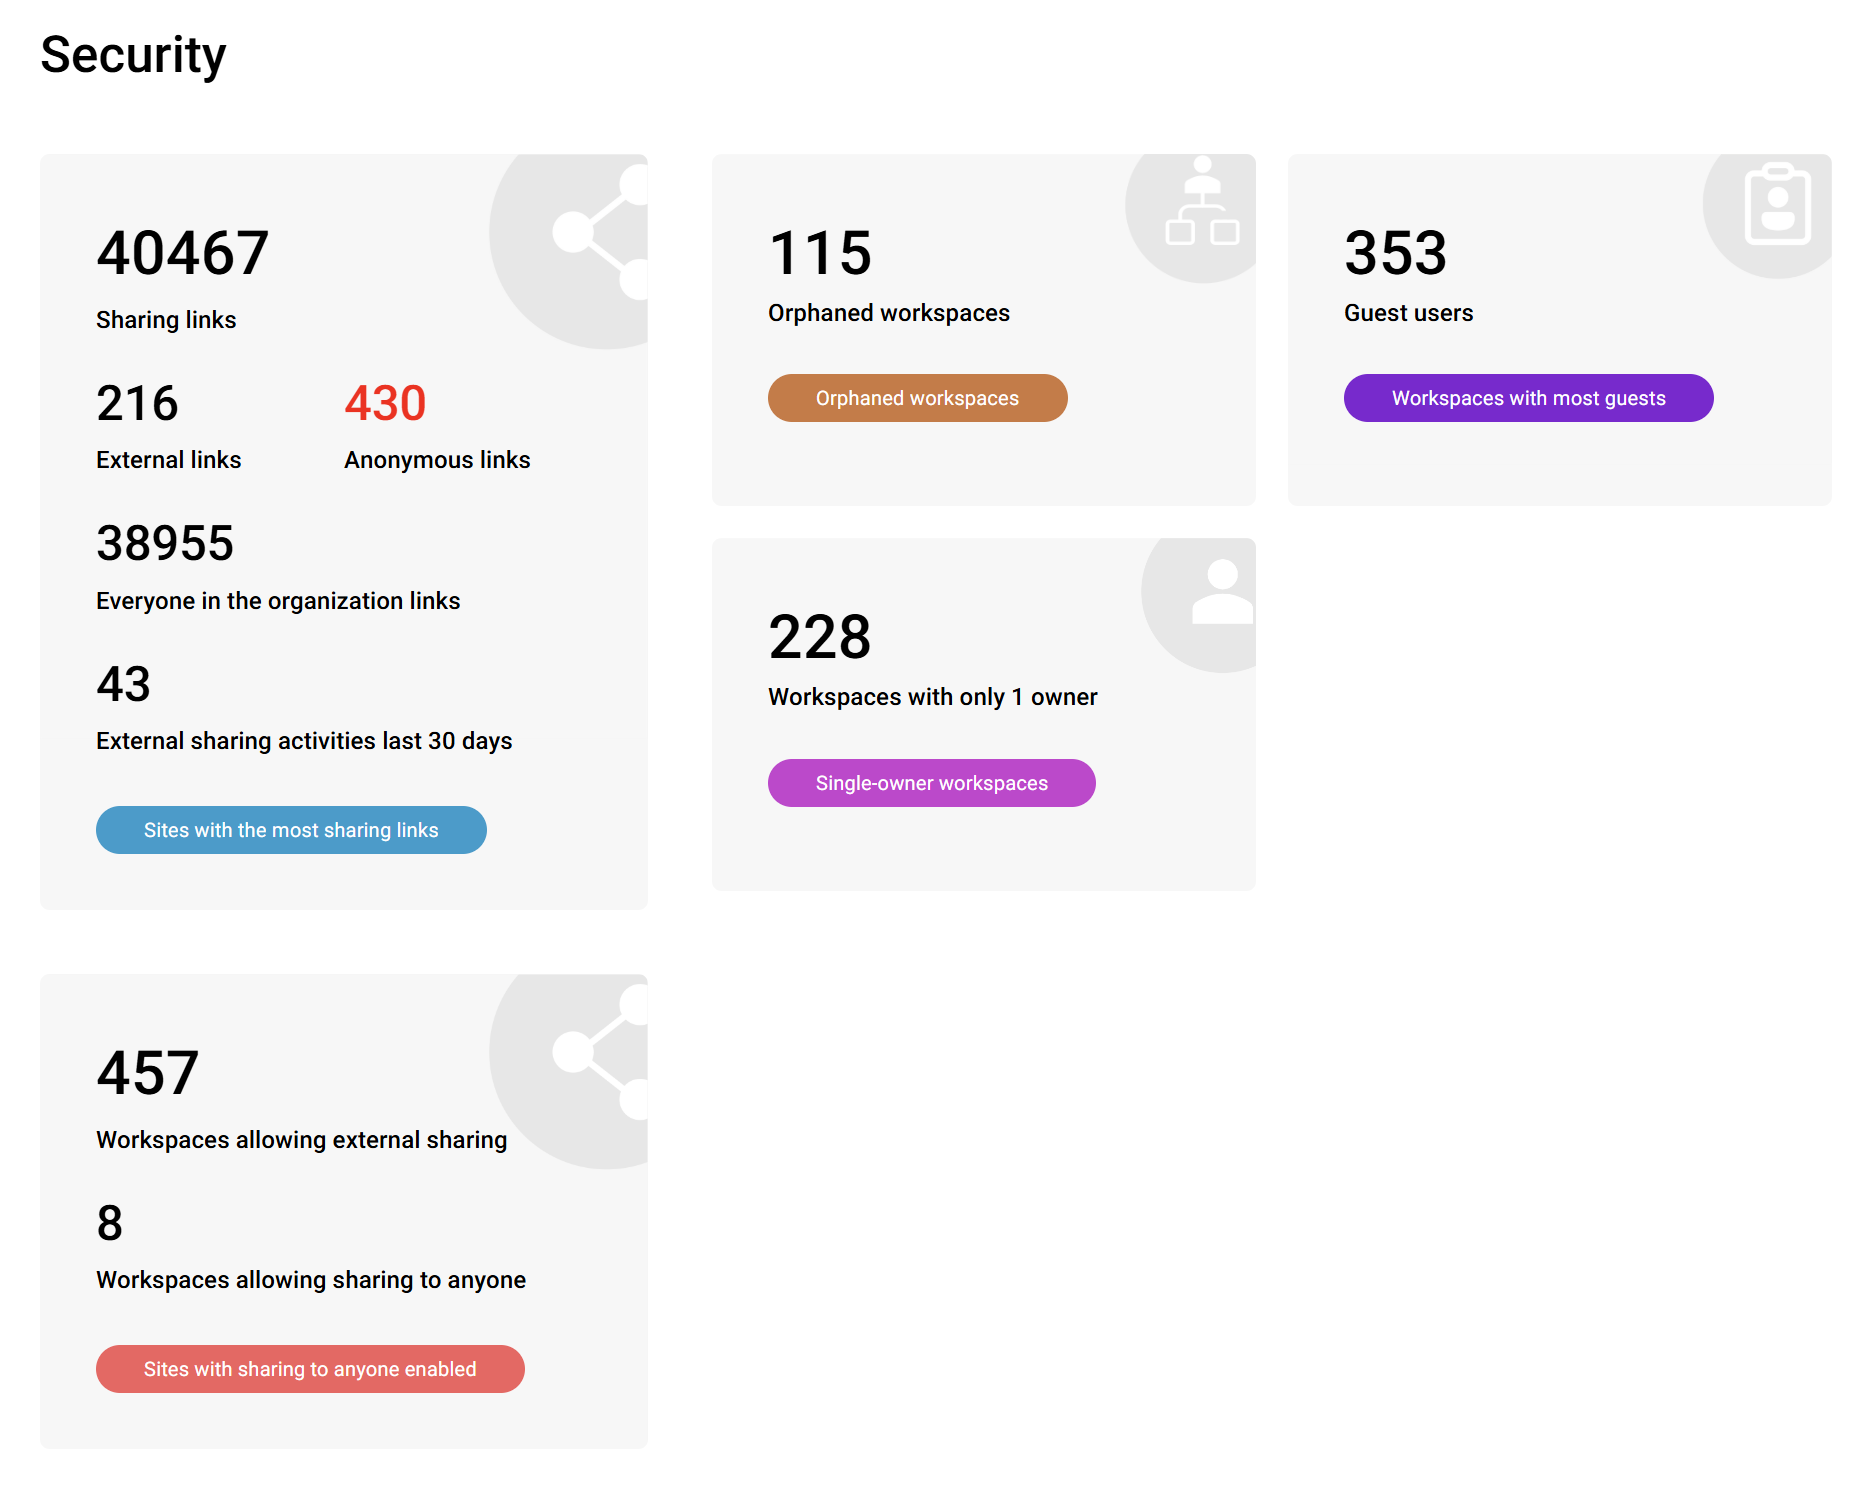
2.2.1 Sharing links
Sharing links found in sites where link retrieval has been requested are displayed by category.
- Total number of sharing links across all interrogated sites
- Number of external links
- Number of anonymous links (these are high risk and are displayed in red)
- Number of Everyone in the organization (also known as People in your organization) linksA
- A count of external sharing activities in the last 30 days
You can click through to the Sites with most sharing links review for a detailed list of all sites that have been scanned.
2.2.2 Sharing settings
You can see a count of sites which allow external sharing, and also of those which allow anonymous external sharing (regardless of whether anonymous sharing links have been created). Clicking through to the Sites with sharing to anyone enabled review displays a report of all sites that meet this criteria.
2.2.3 Orphans and sites with ownership at risk
This section displays counts for two types of sites with risky ownership:
- Orphans - Sites and teams with no group owners, no site owners if they're not group connected, or no connected group (group-orphaned)
- Workspaces with only 1 owner - Sites and teams which only have a single owner and are at risk of being easily orphaned as a result.
2.2.4 Guest users
This metric displays the total count of guest users assigned access to sites on the tenant. You can click through to the Workspaces with most guests review to see a detailed report of which sites contain the most guests, and what their sharing settings are.
2.3 Content
The Content section provides insights into the composition of topics within your tenant, and also highlights content and sites/lists which you may want to investigate more closely because they are unnecessary or deviate from best practices.
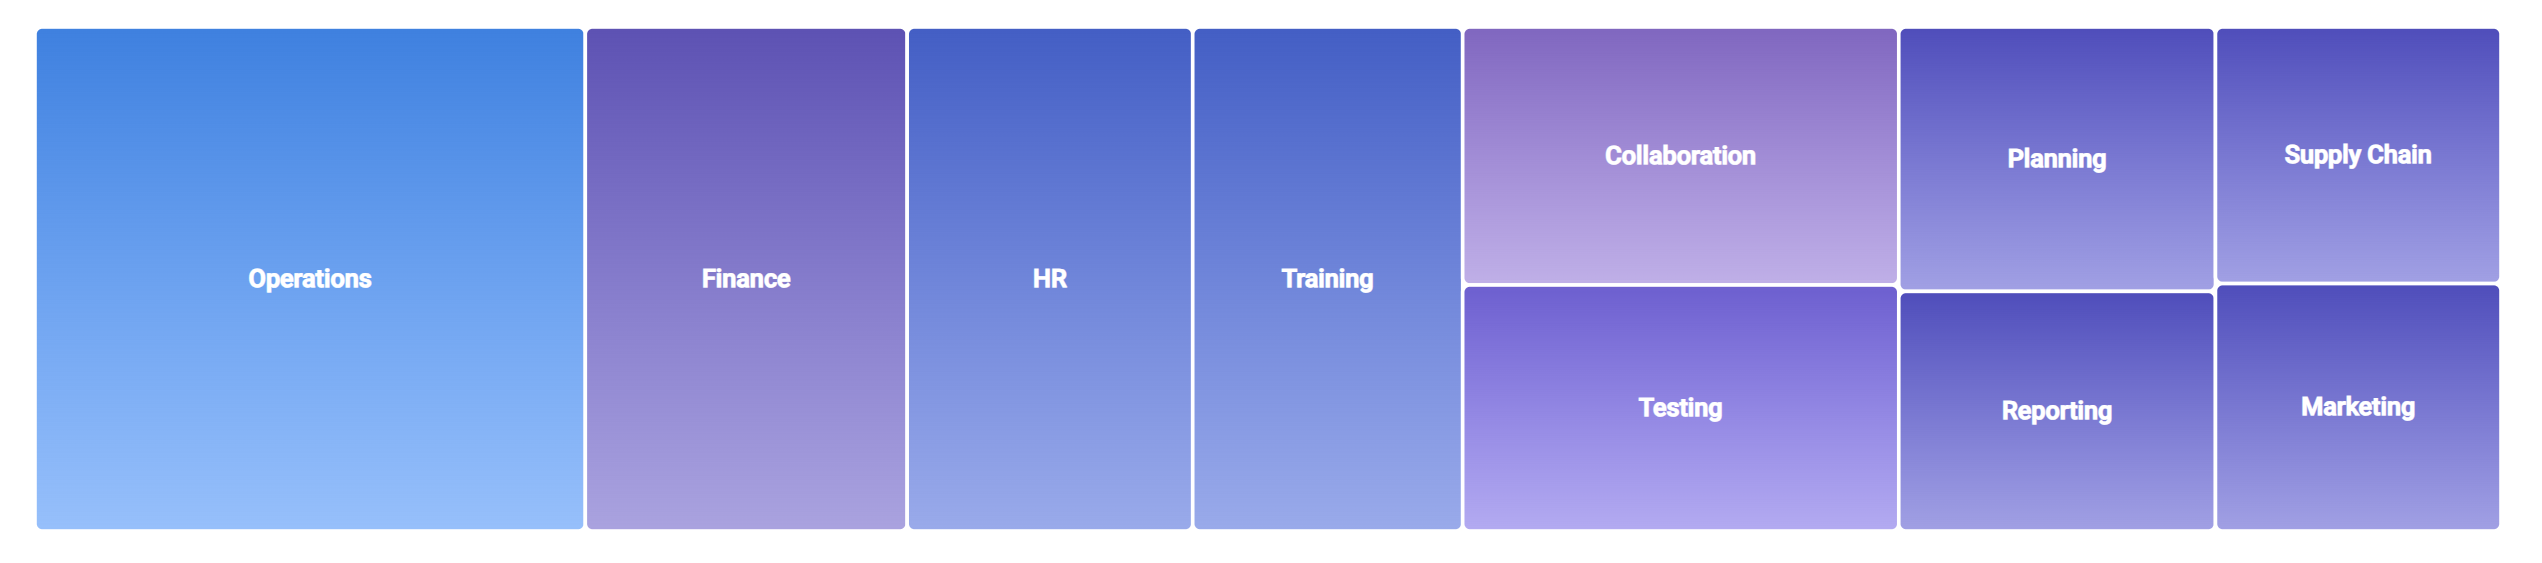
2.3.1 Content topics
- If you have the AI plan, you can see the 10 most common content topics found in the tenant by the AI assessment. You can click through to Discover all topics to see all topics, and then browse to find and analyse sites by topic from there.
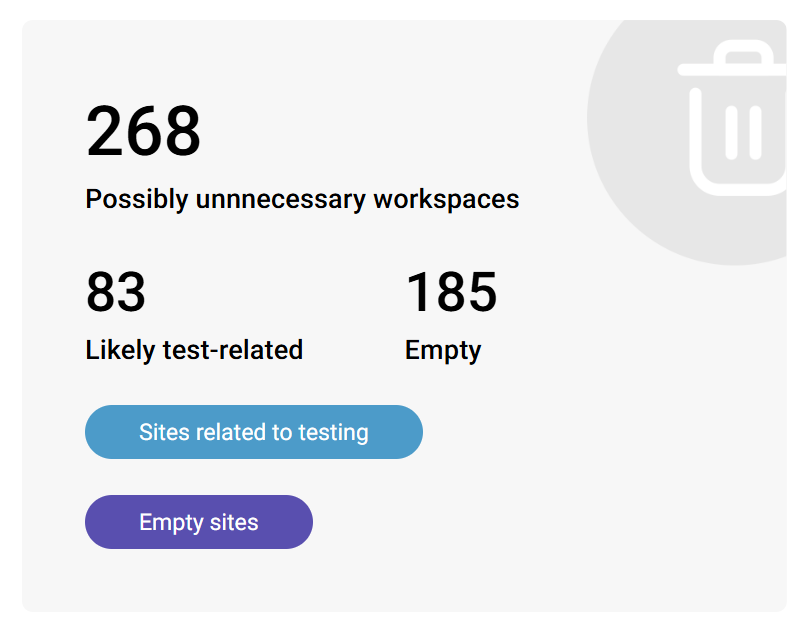
2.3.2 Possibly unnecessary content
If you have the AI plan, sites which have been identified as empty or test-related are listed.
- Empty sites are those which contain no user-generated content and were created (possibly even with a full library, list or folder structure) but no library or list items besides the home page are present.
- Test-related sites are those which either have a name related to testing, or contain a large number of libraries, folders or files containing words related to testing.
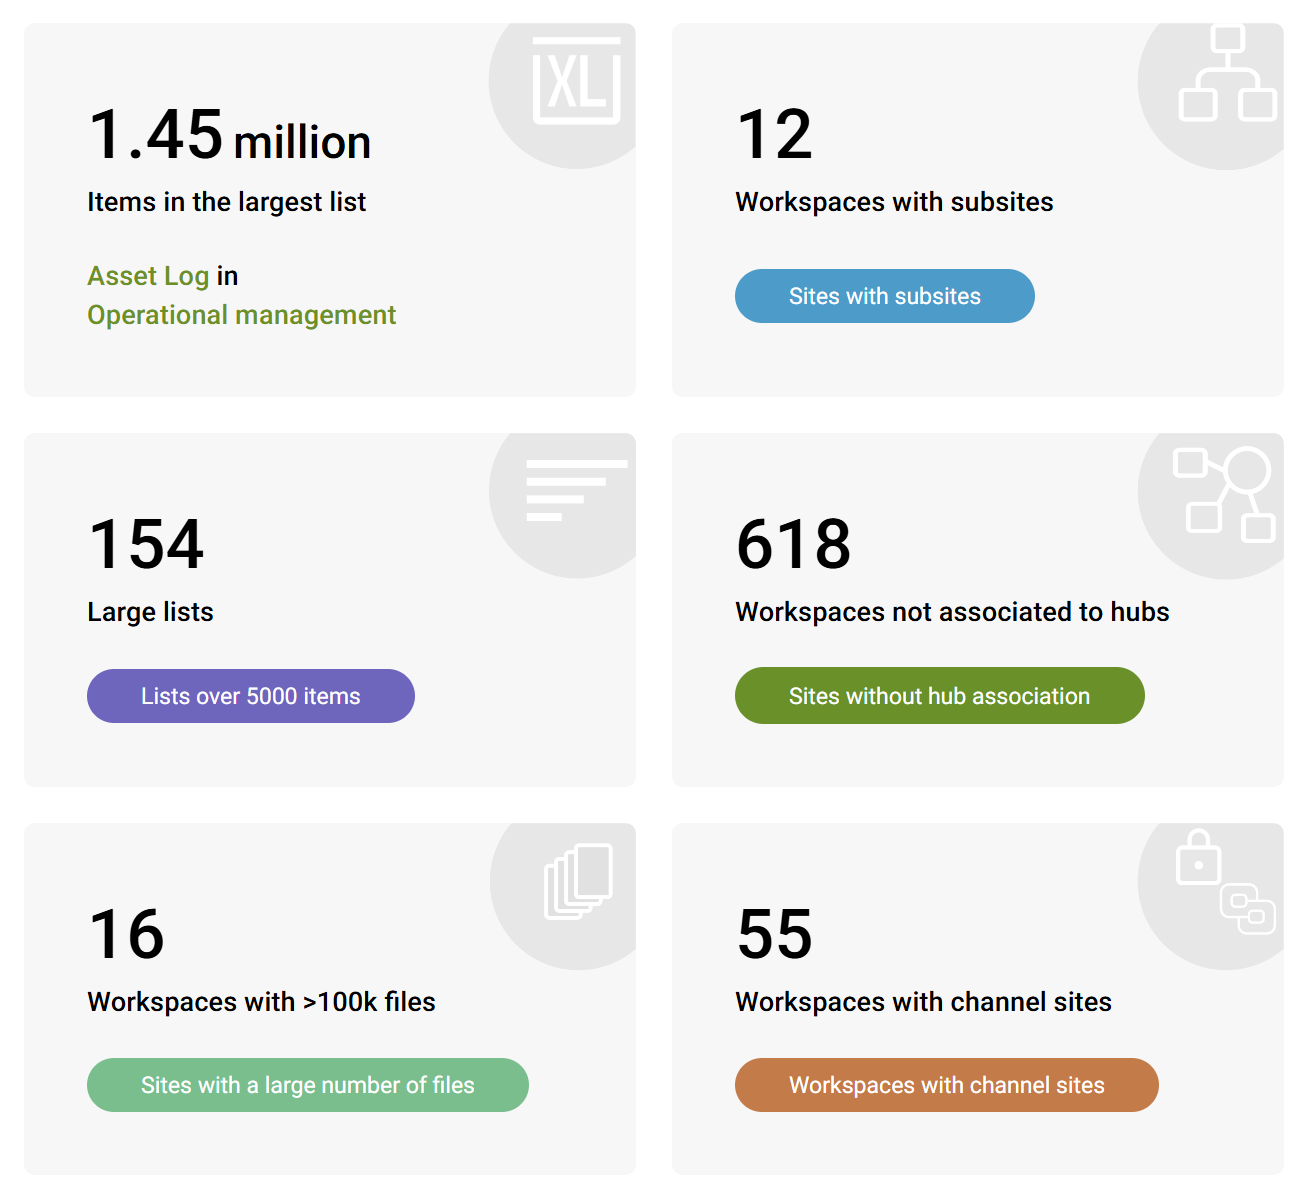
2.3.3 Notable content states
You can see sites and lists which you might want to monitor closely in this section, either because you might not be aware of their states, or because they don't follow ideal best practices.
- Largest list in the tenant
- Count of lists containing more than 5 000 items (the list view threshold in SharePoint)
- Count of sites containing more than 100 000 files
- Count of sites with subsites (against Microsoft's recommendations)
- Count of sites not associated to hubs
- Count of sites with channel sites
2.4 Activity
The Activity category displays inactive files and sites, as well as aggregated file activity for the last 30 days.
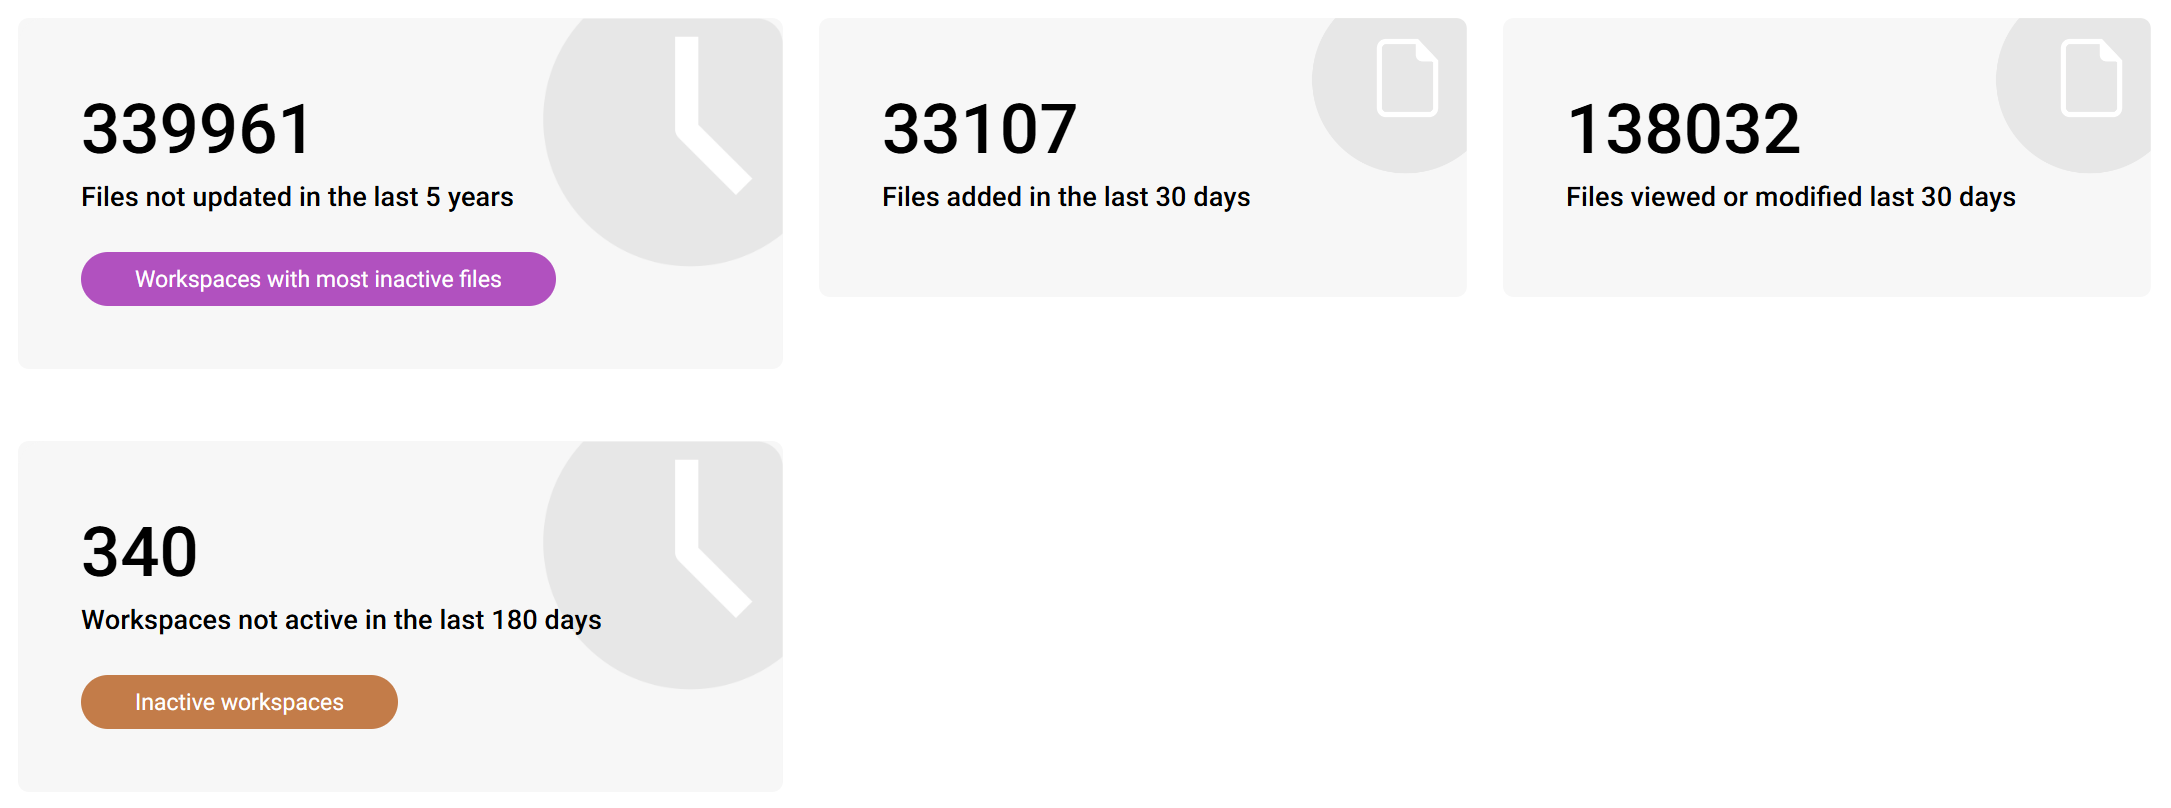
2.4.1 Inactive files
This metric displays the total number of files across the tenant which haven't been updated in 3, 5 or 7 years, depending on the threshold you have configured.
You can click through to the Workspaces with most inactive files review to view a report of the sites in which these files are contained. This report enables you to identify sites with a high percentage of inactive files, instead of simply inactive sites, and then clean these files up.
2.4.2 Inactive sites
This metric displays a count of the number of sites with last acitivity older than 30 days.
Notes on Last activity:
- In SProbot, Last activity uses the LastItemUserModifiedDate property for a site, which is based on updates, not views.
- In the case of Teams workspaces, it's important to be aware that activity in both SProbot and the SharePoint Admin Center is related to the SharePoint site of a team only, and does not include any activities in Teams (like channel conversations), so it's recommended to confirm archives or deletions with owners to avoid any doubt.
2.4.3 File activity
The Files added in the last 30 days and Files viewed or modified in the last 30days metrics are aggregated reports from the SharePoint admin center.
Note: These counts are not determined by the SProbot index or crawl, and may be delayed by several days.